SCHEDULE 14A INFORMATION
SECURITIES EXCHANGE ACT OF 1934
(AMENDMENT NO. )
| ||
| ||
| ||
| ||
| ||
| ||
| ||
| ||
| ||
| ||
| ||


PROASSURANCE CORPORATION
Birmingham, Alabama 35209
24, 2023
|
|
|
|


SCHEDULE 14A INFORMATION
SECURITIES EXCHANGE ACT OF 1934
(AMENDMENT NO. )
| ||
| ||
| ||
| ||
| ||
| ||
| ||
| ||
| ||
| ||
| ||
PROASSURANCE CORPORATION
Birmingham, Alabama 35209
24, 2023
|
|
|
|
Birmingham, Alabama 35209
to be held May 20, 2020
24, 2023
statement and on the frequency that we will hold advisory votes on executive compensation.
What constitutes a quorum?
•by signing and returning the enclosed proxy card in the enclosed envelope; or
•by using the internet in accordance with instructions on the enclosed proxy card; or
•by using a touchtone telephone and following the instructions on the enclosed proxy card.
2
later date, or (iii) by giving written notice of revocation to the Secretary of ProAssurance. You may also revoke your proxy by voting your shares at the annual meeting. The mailing address of ProAssurance is P.O. Box 590009, Birmingham, Alabama 35259-0009, and the street address is 100 Brookwood Place, Birmingham, Alabama 35209.
3
Board of Directors at the 20202023 annual meeting as Class I directors, to serve until the annual meeting in 2023. Robert E. Flowers, M.D., has been nominated for election to the Board of Directors at the 2020 annual meeting as a Class I director, to serve until the annual meeting in 2021. Dr. Flowers has agreed to retire from the board at the 2021 annual meeting in anticipation of creating a vacancy on the board for the election of a nominee made pursuant to the Agreement and Plan of Acquisition with NORCAL Mutual Insurance Company, which we disclosed in a Form8-K filed on February 21, 2020 and is expected to close prior to the 2021 annual meeting.
Samuel A. Di Piazza, Jr., C.P.A.(Age 69) has served as a director of ProAssurance since January 2014. Mr. Di Piazza is a member of the Board of Trustees of Mayo Clinic and was appointed its Chairman in February 2014. Mr. Di Piazza served as Vice Chairman of the Institutional Clients Group of Citibank from 2011 until his retirement from Citibank in February 2014. Prior to his service with Citibank, Mr. Di Piazza was a partner with PricewaterhouseCoopers LLP (and its predecessor, Coopers & Lybrand) for thirty years. Mr. Di Piazza currently serves as a director for AT&T Inc. (NYSE:T) (and for DIRECTV prior to its merger with AT&T), Jones Lang Lasalle, Inc. (NYSE:JLL); Regions Financial Corporation (NYSE:RF); and formerly served as a director of Apollo Education Group, Inc. (NASDAQ:APOL).
Robert E. Flowers, M.D. (Age 70) has served as a director of ProAssurance since June 2001 and served as our lead director from 2012 to 2018. Prior to June 2001, Dr. Flowers served as a director of our insurance subsidiary, ProAssurance Indemnity Company, Inc. (formerly, The Medical Assurance Company, Inc.) from 1985 to 2001, and as a director of its former holding company, Medical Assurance, Inc. (1995-2001). Dr. Flowers practiced as a physician with Gynecology Associates of Dothan P.C., Dothan, Alabama, prior to his retirement in 2001.
Edward L. Rand, Jr. (Age 53) was elected to the Board of Directors in 2019 for aone-year term expiring at the 2020 annual meeting. Mr. Rand is the President and Chief Executive Officer of ProAssurance Corporation. Mr. Rand, who assumed this position at ProAssurance on July 1, 2019, was formerly Chief Operating Officer, and has served as Chief Financial Officer, Executive Vice President, and Senior Vice President of Finance since joining ProAssurance in November of 2004. Prior to joining ProAssurance, Mr. Rand was Chief Accounting Officer and Head of Corporate Finance for PartnerRe Ltd. from 2000 - 2004. He also served as the Chief Financial Officer of Atlantic American Corporation from 1996 - 2000 and Controller of United Capitol Insurance Company from 1992 - 1996. Prior to that time, Mr. Rand was employed by Coopers & Lybrand (now PriceWaterhouseCoopers) for four years. Mr. Rand is a graduate of Davidson College, where he received a B.A. in Economics.
Katisha T. Vance, M.D. (Age 45) has served as a director of ProAssurance since May 2017. Dr. Vance is a board-certified oncologist / hematologist practicing at Birmingham Hematology and Oncology (d/b/a Alabama Oncology) in Birmingham, Alabama. She has previously served as the President of the Jefferson County Medical Society. Dr. Vance received her M.D. degree from the University of Alabama School of Medicine in Birmingham, Alabama, trained in internal medicine at Baptist Health System in Birmingham, Alabama, and completed a fellowship in medical oncology and hematology at the University of Alabama at Birmingham.
2026.

Fabiola Cobarrubias, M.D. (Age 56) was elected to the Board of Directors in May 2021 and previously served as Vice Chair of NORCAL’s Board, Chair of the Governance Committee, and a member of the Audit and Investment Committees. Dr. Cobarrubias also served on the Board of Preferred Physicians Medical RRG, a NORCAL affiliate that provides specialty medical professional liability insurance for Anesthesia. Dr. Cobarrubias holds an M.B.A. from Haas School of Business at the University of California, Berkeley, an M.D. from the University of California, San Francisco, and a Bachelor of Science degree from Brown University. Dr. Cobarrubias has served as a hospitalist at the California Pacific Medical Center for over 25 years, where she held the position of Medical Director – Hospitals Service from 2004 to 2011. She is also a founder, CEO, and current board Member of Pacific Inpatient Medical Group, where she is responsible for high-level management and administration of all aspects of the physician-owned hospitalist medical group consisting of more than 75 physicians across five different acute care hospitals throughout the San Francisco Bay Area. | |||||||||||

Samuel A. Di Piazza, Jr., C.P.A. (Age 72) has served as a director of ProAssurance since January 2014. Mr. Di Piazza is the former Chairman of the Board of Trustees of Mayo Clinic, having served on the Board from 2010 to 2022. Mr. Di Piazza served as Vice Chairman of the Institutional Clients Group of Citibank from 2011 until his retirement from Citibank in February 2014. Prior to his service with Citibank, Mr. Di Piazza was a partner with PricewaterhouseCoopers LLP (and its predecessor, Coopers & Lybrand) for thirty-six years and served as its Global CEO from 2001 until 2009. Mr. Di Piazza currently serves as Chairman of Warner Bros. Discovery Inc. (NASDAQ:WBD), and as a director of Jones Lang Lasalle, Inc. (NYSE:JLL); and Regions Financial Corporation (NYSE:RF). | ||||||||||||||

Edward L. Rand, Jr. (Age 56) is the President and Chief Executive Officer of ProAssurance Corporation and was first elected to the Board of Directors in 2019. He formerly served as Chief Operating Officer, Chief Financial Officer, Executive Vice President, and Senior Vice President of Finance since joining ProAssurance in November of 2004. Prior to joining ProAssurance, Mr. Rand was Chief Accounting Officer and Head of Corporate Finance for PartnerRe Ltd. from 2000 to 2004. He also served as the Chief Financial Officer of Atlantic American Corporation from 1996 to 2000 and Controller of United Capitol Insurance Company from 1992 to 1996. Prior to that time, Mr. Rand was employed by Coopers & Lybrand (now PriceWaterhouseCoopers) for four years. Mr. Rand is a graduate of Davidson College, where he received a B.A. in Economics. | ||||||||||||||

Katisha T. Vance, M.D. (Age 48) has served as a director of ProAssurance since May 2017. Dr. Vance is a board-certified oncologist / hematologist practicing at Birmingham Hematology and Oncology (d/b/a Alabama Oncology) in Birmingham, Alabama. She has previously served as the President of the Jefferson County Medical Society. Dr. Vance received her M.D. degree from the University of Alabama School of Medicine in Birmingham, Alabama, trained in internal medicine at Baptist Health System in Birmingham, Alabama, and completed a fellowship in medical oncology and hematology at the University of Alabama at Birmingham. | ||||||||||||||
4
OurBy-Laws require majority voting for the election of directors in uncontested elections (elections where the number of nominees is not greater than the number of directors to be elected). Directors in uncontested elections must receive a greater number of votes “for” their election than votes “withheld” from such election. OurBy-Laws provide that directors in contested elections are elected under a plurality vote standard in which nominees receiving the most votes are elected, regardless of how many shares are voted against the nominee. A contested election is one in which there are more nominees than directors to be elected. The election of directors pursuant to this Proposal 1 is an uncontested election.
ratification of the appointment of the Corporation’s independent registered public accounting firm.
5
The Board of Directors has nominated Fabiola Cobarrubias, M.D., Samuel A. Di Piazza, Jr., C.P.A., Robert E. Flowers, M.D., Edward L. Rand, Jr., and Katisha T. Vance, M.D. for election to the Board of Directors at the 20202023 annual meeting as Class I directors as set forth above under the caption “Proposal 1 — Election of Directors.” Messrs. Di Piazza and Rand and Drs. Flowers and Vance are currently Class I directors whose terms will expire at the annual meeting. Information regarding the nominees is set forth above and information regarding the directors continuing in office is set forth below, all of which was confirmed by them for inclusion in this proxy statement. Information regarding stock ownership by the nominees and continuing directors is set forth in the table under the caption “Beneficial Ownership of Our Common Stock” included elsewhere in this proxy statement.
M. James Gorrie(Age 57) has served as a director of ProAssurance since May 2012. Mr. Gorrie is the President and Chief Executive Officer of Brasfield & Gorrie, Inc. in Birmingham, Alabama, a construction firm with recent annual revenues in excess of $2 billion. He holds a B.S. in Building Science from Auburn University and serves as a Director of First Commercial Bank (a division of Synovus Bank (NYSE: SNV), one of the largest community banks in the Southeast) and was a director of Energen Corporation (NYSE: EGN) prior to its acquisition by Diamondback Energy in 2018.
Ziad R. Haydar, M.D. (Age 57) has served as a director of ProAssurance since May 2015 and is an independent healthcare consultant. He was Senior Vice President and Chief Clinical Officer of Ascension Health in St. Louis, Missouri from July 2015 until June 2019, and prior to that was Chief Medical Officer since 2012. Ascension Health is the largestnot-for-profit and largest Catholic health system in the United States. Dr. Haydar began his tenure at Ascension Health in 2010 as its Vice President Clinical Excellence and Physician Integration until he was promoted to Vice President and Chief Medical Officer in 2011, and he served in that position until his appointment to Senior Vice President and Chief Clinical Officer in July 2015. Prior to 2010, Dr. Haydar was an executive with Baylor Health Care System in Dallas, Texas. Dr. Haydar received his M.D. degree from American University in Beirut, trained in Family Medicine at the Medical University of South Carolina, and completed a fellowship in Geriatrics and Gerontology at Johns Hopkins University School of Medicine.
Frank A. Spinosa, D.P.M. (Age 65) has served as a director of ProAssurance since May 2012. Dr. Spinosa is a board-certified podiatrist and practices as a partner at Foot and Ankle Associates of New Mexico in Albuquerque, New Mexico. Dr. Spinosa serves as a member of the Board of Trustees of New Mexico Podiatric Medical Association. He served as a member of the Board of Trustees of the American Podiatric Medical Association through March 2016, and served as president of both the American Podiatric Medical Association and the New York State Podiatric Medical Association. He has taught as an Associate Professor of Radiology at the New York College of Podiatric Medicine.
Thomas A. S. Wilson, Jr., M.D.(Age 58) has served as a director of ProAssurance since May 2012. Dr. Wilson is a recently retired board-certified neurosurgeon, having practiced with Neurosurgical Associates, P.C., in Birmingham, Alabama for more than 20 years. He holds a B.S. in natural science and mathematics from Washington & Lee University and an M.D. from Vanderbilt University. He completed an internship in general surgery and a residency in neurosurgery at Bowman Gray School of Medicine, Wake Forest University. The Board of Directors elected Dr. Wilson to the position of Lead Director in May 2018.
2024

M. James Gorrie (Age 61) has served as a director of ProAssurance since May 2012. Mr. Gorrie is the President and Chief Executive Officer of Brasfield & Gorrie, Inc. in Birmingham, Alabama, a construction firm with recent annual revenues in excess of $2 billion. He holds a B.S. in Building Science from Auburn University and serves as a Director of First Commercial Bank (a division of Synovus Bank (NYSE: SNV), one of the largest community banks in the Southeast) and was a director of Energen Corporation (NYSE: EGN) prior to its acquisition by Diamondback Energy in 2018. | ||||||||||||||

Ziad R. Haydar, M.D. (Age 62) has served as a director of ProAssurance since May 2015 and is an independent healthcare consultant. Dr. Haydar has been Chief Medical Officer of Alpine Physician Partners since November of 2020. He was Senior Vice President and Chief Clinical Officer of Ascension Health in St. Louis, Missouri from July 2015 until June 2019, and prior to that was Chief Medical Officer since 2012. Ascension Health is the largest not-for-profit and largest Catholic health system in the United States. Dr. Haydar began his tenure at Ascension Health in 2010 as its Vice President Clinical Excellence and Physician Integration until he was promoted to Vice President and Chief Medical Officer in 2011, and he served in that position until his appointment to Senior Vice President and Chief Clinical Officer in July 2015. Prior to 2010, Dr. Haydar was an executive with Baylor Health Care System in Dallas, Texas. Dr. Haydar received his M.D. degree from American University in Beirut, trained in Family Medicine at the Medical University of South Carolina, and completed a fellowship in Geriatrics and Gerontology at Johns Hopkins University School of Medicine. | ||||||||||||||

Frank A. Spinosa, D.P.M. (Age 68) has served as a director of ProAssurance since May 2012. Dr. Spinosa is a board- certified podiatrist affiliated with First Nations Community Healthsource clinic in Albuquerque, New Mexico. He has served as a member of the Board of Directors of the New Mexico Podiatric Medical Association. He has served as a president of both the New York State Podiatric Medical Association and the American Podiatric Medical Association. He has taught as an Associate Professor of Radiology at the New York College of Podiatric Medicine and is a Faculty Fellow in podiatric medicine at the Royal College of Physicians and Surgeons, Glasgow. He is board-certified by the National Association of Corporate Directors. | ||||||||||||||

Thomas A. S. Wilson, Jr., M.D. (Age 62) has served as a director of ProAssurance since May 2012. Dr. Wilson is a retired board-certified neurosurgeon, having practiced with Neurosurgical Associates, P.C., in Birmingham, Alabama for more than 20 years. He holds a B.S. in natural science and mathematics from Washington & Lee University and an M.D. from Vanderbilt University. He completed an internship in general surgery and a residency in neurosurgery at Bowman Gray School of Medicine, Wake Forest University. The Board of Directors first elected Dr. Wilson to the position of Lead Director in May 2018. | ||||||||||||||
Kedrick D. Adkins Jr., C.P.A.(Age 67) was elected to the Board of Directors in May 2018. Mr. Adkins served as the Chief Financial Officer for the Mayo Clinic from 2014 through his retirement at the end of 2017. He also served as the President of Integrated Services of Trinity Health Care from 2007 to 2014. Prior to his service at Trinity Health Care, Mr. Adkins had a30-year tenure at Accenture, a global management consulting firm. Mr. Adkins holds a B.S. in Industrial and Operations Engineering and an M.B.A. in Finance and Accounting from the University of Michigan. In addition, Mr. Adkins is a certified public accountant. In the past five years, Mr. Adkins has served on the Advisory Board of Welsh, Carson, Anderson & Stowe, an investment
2025

Kedrick D. Adkins Jr., C.P.A. (Age 70) was elected to the Board of Directors in May 2018. Mr. Adkins served as the Chief Financial Officer for the Mayo Clinic from 2014 through his retirement at the end of 2017. He also served as the President of Integrated Services of Trinity Health Care from 2007 to 2014. Prior to his service at Trinity Health Care, Mr. Adkins had a 30-year tenure at Accenture, a global management consulting firm. Mr. Adkins holds a B.S. in Industrial and Operations Engineering and an M.B.A. in Finance and Accounting from the University of Michigan. In addition, Mr. Adkins is a certified public accountant. In the past five years, Mr. Adkins has served on the Advisory Board of Welsh, Carson, Anderson & Stowe, an investment firm specializing in healthcare and technology, and the board of directors for Christus Health, the University of Michigan Hospital System, and Medical Memory, a medical technology startup. | ||||||||||||||

Bruce D. Angiolillo, J.D. (Age 70) has served as a director of ProAssurance since May 2016 and was elected Chairman of the Board in May 2022. He is a retired partner of Simpson Thacher & Bartlett LLP, New York, New York. Mr. Angiolillo joined Simpson Thacher in 1980 and developed a practice in the areas of securities and other complex commercial litigation from which he retired on December 31, 2014. Following his retirement from Simpson Thacher, Mr. Angiolillo was employed from January 1, 2015 until June 30, 2015, as general counsel for TK Holdings, Inc., a subsidiary of Takata Corporation, which was a global automotive parts manufacturer and supplier. | ||||||||||||||

Maye Head Frei (Age 52) was first elected to the Board of Directors in 2019. She is the former Chairman of Ram Tool Construction Supply Company, which until its sale in December 2021 was one of the largest women-owned and privately-owned businesses in Alabama. Serving in various roles from 1997–2021, she guided the company from less than $30 million to nearly $1 billion in annual sales. She continues to oversee real estate assets and develop commercial property throughout the Southeast and Texas. Ms. Frei holds a B.A. in History from Yale University and also attended the Sorbonne in Paris, France. She serves as Chairman Emeritus for the Birmingham Museum of Art, President of the Board of Trustees for the Highlands School, and Treasurer for the Women’s Foundation of Alabama. She is a board member of the Hugh Kaul Foundation, a philanthropic institution that has invested nearly $80 million in the Greater Birmingham region, and of the Alabama Trails Foundation. | ||||||||||||||

Scott C. Syphax (Age 59) was elected to the Board of Directors in May 2021 and previously served as a member of NORCAL’s board, Chair of the Transactions Committee, and as a member of the Executive and Investment Committees. Mr. Syphax holds a Bachelor of Science degree from California State University, Sacramento. Mr. Syphax previously served as the Chairman and CEO of The Nehemiah Companies, a Sacramento-based social enterprise and real estate development firm where he managed the Nehemiah Community Reinvestment Fund, which facilitated development in underserved communities across the United States and provided down payment assistance funding for families seeking to acquire homes. He is the President and Chief Executive Officer of Syphax Strategic Solutions, a Sacramento-based management consulting company focusing on the healthcare, real estate, and financial services industries. Mr. Syphax also serves as Chairman of the Nehemiah Community Foundation, sponsor of the Nehemiah Emerging Leaders Program which Mr. Syphax founded in 2009, and as a Director for the respective Boards of the Federal Home Loan Bank of San Francisco and the Sacramento Regional Community Foundation. | ||||||||||||||
firm specializing in healthcare and technology, and the board of directors for Christus Health, the University of Michigan Hospital System, and Medical Memory, a medical technology startup.
Bruce D. Angiolillo, J.D. (Age 67) has served as a director of ProAssurance since May 2016. He is a retired partner of Simpson Thacher & Bartlett LLP, New York, New York. Mr. Angiolillo joined Simpson Thacher in 1980 and developed a practice in the areas of securities and other complex commercial litigation from which he retired on December 31, 2014. Following his retirement from Simpson Thacher, Mr. Angiolillo was employed from January 1, 2015 until June 30, 2015, as general counsel for TK Holdings, Inc., which is a subsidiary of Takata Corporation, a global automotive parts manufacturer and supplier based in Auburn Hills, Michigan.
Maye Head Frei(Age 49) was first elected to the Board of Directors in 2019. Ms. Frei serves as the Chairman of Ram Tool Construction Supply Company based in Birmingham, Alabama, where she has been serving in various roles since 1997. Ram Tool is a family-owned construction supply distributor and one of the largest women-owned businesses in Alabama. Ms. Frei holds a B.A. in History from Yale University, and she completed post-graduate studies at the Sorbonne in Paris, France. She serves on the Board of Trustees for the Birmingham Museum of Art and the Board of Trustees for the Highlands School in Birmingham. In addition, she serves on the boards of the Hugh Kaul Foundation and the Alabama Trails Foundation.
W. Stancil Starnes, J.D.(Age 71) was elected to the Board of Directors in September 2007 and serves as its Executive Chairman. Mr. Starnes was appointed Chief Executive Officer of ProAssurance on July 2, 2007 and served in that role through June 2019. Prior to joining ProAssurance, Mr. Starnes served as the senior and managing partner of the law firm of Starnes & Atchison LLP in Birmingham, Alabama, where he was extensively involved with ProAssurance and its predecessors in the defense of medical liability claims for over 25 years. He withdrew from the firm in October 2006 to serve as President, Corporate Planning and Administration of Brasfield & Gorrie, Inc., a commercial construction firm based in Birmingham, Alabama, where he served until May 2007. Mr. Starnes served as a director of two public companies that have since been acquired, National Commerce Corp. (NASDAQ: NCOM) and Infinity Property and Casualty Corporation (NASDAQ: IPCC). At National Commerce Corporation he served as the Chairman of the both the risk committee and the nomination and corporate governance committee; and was a member of the Compensation Committee. At Infinity Property and Casualty Corporation (NASDAQ: IPCC), he served on the audit, compensation and executive committees.
| Kedrick D. Adkins Jr., C.P.A. | ||||||
| Bruce D. Angiolillo, J.D. | ||||||
| Fabiola Cobarrubias, M.D. | Scott C. Syphax | |||||
| Samuel A. Di Piazza, Jr., C.P.A. | ||||||
| Katisha T. Vance, M.D. | ||||||
| Maye Head Frei | Thomas A. S. Wilson, Jr., M.D. | |||||
| M. James Gorrie | ||||||
Since 2012, our
7
whether such relationship precludes a finding of independence in the Board’s business judgment. The Board considered the following relationships in its evaluation of the independence of ournon-management directors.
8
and the Audit Committee. Mr. Angiolillo’s onlyIn reviewing Dr. Cobarrubias’ qualifications to serve on the Audit Committee, the Board evaluated the above-described relationship withas required by the Company is hisNYSE and SEC Rules. The Board determined that the existence of this relationship did not preclude Dr. Cobarrubias from service on the Board, the Audit Committee and the Compensation Committee. The Board of Directors also carefully evaluated the independence of Dr. Spinosa with respect to the above-described relationships and determined that such relationships should not impair his ability to be independent under the NYSE and SEC standardsrequirements for members of the Audit Committee.audit committee members. As a result, the Board determined that each of these directors was permitted to serve on the Audit Committee under the requirements of the SEC and NYSE rules.
rules, as well as under the Governance Guidelines.
•Our primary product has historically been professional liability insurance for healthcare providers. We believe that it is important to have on our Board healthcare professionals who are, or have been, consumers of our insurance products and who understand the business and professional needs of our customers.
•We believe that it is important to have on our Board persons with business experience, including experience in the governance of publicly traded companies.
|
9
Ascension Health until June 2019. Dr. Wilson who recently retired from the practice of medicine, was a board-certified neurosurgeon and practiced for over 20 years prior to his retirement in 2019 and has authored numerous publications and presentations.
Dr. Haydar brings valuable healthcare and business knowledge to the Board of Directors. Although currently an independent consultant on clinical matters, Dr. Haydar served as Chief Clinical Officer of Ascension Health, which is the largestnot-for-profit, and largest Catholic health system in the United States, from July 2015 to June 2019, and as its Chief Medical Officer from 2012.
In addition to our physician directors, W. Stancil Starnes, who served as our Chief Executive Officer from 2007 until 2019, represented practicing physicians and healthcare entities in the defense of medical malpractice claims for over 25 years. Mr. Starnes brings to the Board a deep understanding of the legal and professional issues involved in resolving claims and how best to deliver the claims defense that is the key component of our insurance products.
Mr. Rand served as Chief Financial Officer of ProAssurance from 2004 to 2018, and President and Chief Operating Officer from 2018 until his appointment as Chief Executive Officer in July 2019. He was elected to the Board after his appointment as President, as it has been our practice for our President to serve on our Board of Directors.President. Mr. Rand also brings his considerable financial and business knowledge to the Board of Directors.
10
Mr. Di Piazza served in numerous leadership positions during his career with PricewaterhouseCoopers, LLP including serving as the firm’s Global Chief Executive Officer and a member of its Global Leadership Team, serving as Chairman and Senior Partner at PricewaterhouseCoopers, and serving as the leader of local offices in Chicago, New York City and Birmingham. Following his tenure at PricewaterhouseCoopers, Mr. Di Piazza served as a leader of the Citi International Client Group at Citigroup, where he was Vice Chairman at the time of his retirement in February 2014. The Citi International Client Group provides corporate, institutional, public sector and high net worth international clients with a full range of wholesale banking products and services.
Diversity: elsewhere.
The composition of our Board demonstrates our commitment to diversity, as three of our eleven independent directors are women, three are African-American, one is Latina, and one is Lebanese born. Further, we are mindful of the need for periodic refreshment of the Board to assure the proper balance between the beneficial knowledge and specific business insights of tenured directors and the new ideas and fresh skills of new nominees. None of our eleven independent directors has served on our Board more than eleven years.
| Independent Board Members | |||||||||||
| Tenure | Gender | Race/Ethnicity | Age | ||||||||
| 11 | Male | White | 68 | ||||||||
| 11 | Male | White | 61 | ||||||||
| 11 | Male | White | 62 | ||||||||
| 9 | Male | White | 72 | ||||||||
| 8 | Male | White | 62 | ||||||||
| 7 | Male | White | 70 | ||||||||
| 6 | Female | African American | 48 | ||||||||
| 5 | Male | African American | 70 | ||||||||
| 4 | Female | White | 52 | ||||||||
| 2 | Male | African American | 59 | ||||||||
| 2 | Female | Latina | 56 | ||||||||
Our
Our Corporate Governance Principles require ournon-management directors to hold executive sessions at which neither management nor the Chief Executive Officer is present. The Corporate Governance Principles
11
further provide that the executive sessions ofnon-management directors are to be held on a regularly scheduled basis, not less frequently than two times each year, and that at least one of the executive sessions will be attended by independent directors only. In December 2011, we formally established the position of lead directorLead Independent Director to preside at each executive session. At the annual meeting in May 2019, the independent directors selected Dr. Wilson served as the independent director to presideLead Independent Director and presided at the executive sessions.sessions from May 2018 until May 2022. As independent Chairman, Mr. Angiolillo presides at executive sessions, and the Board has not selected a Lead Independent Director since May 2022. During 2019,2022, our independent directors held an executive session after each quarterly Board meeting.
at least yearly.
The Audit Committee has the primary oversight responsibility for risks relating to financial reporting and compliance. From time to time the Board receives input from external advisors or experts regarding emerging or increasing risk trends that are relevant to the Company and its business.
The Nominating/Corporate Governance Committee has the primary responsibility forfacilities management. Our Board engages in active oversight of thosesuch effects and impacts and has implemented, and continues to implement, policies and procedures to address the societal and environmental effects of our operations and business activities.
12
committees of the board on which he or she served during 20182022 (in each case, which were held during the period for which he or she was a director).
24, 2022.
•identify individuals qualified to become directors and recommend to the Board of Directors for its consideration the candidates for all directorships to be filled by the Board of Directors or to be elected by the stockholders;
•advise the Board of Directors with respect to the board composition, procedures and committees;
•develop and recommend to the Board of Directors a set of corporate governance principles applicable to ProAssurance;
•oversee the evaluation of the Board of Directors and the evaluation of ProAssurance’s management;
•oversee ProAssurance’s efforts to address environmental, social, and governance issues of importance to stakeholders and the risks covered by ProAssurance’s ERM process that are not the responsibilitybusiness of the Audit Committee;Company; and
•otherwise take a leadership role in shaping the corporate governance of ProAssurance.
•the Board of Directors desires tore-nominate an incumbent director for an additional term and the director consents to stand forre-election and to serve on our Board of Directors if elected; or
•the Nominating/Corporate Governance Committee has recommended to our Board of Directors a candidate to fill a vacancy and, prior to the receipt of a properly submitted stockholder nomination, such nominee has agreed to stand for election and serve on our Board if elected.
13
Corporate Governance Principles do not establish any specific requirements of minimum qualifications or skills that an individual candidate must possess other than the maximum age requirements described in the Corporate Governance Principles. Rather, the Corporate Governance Principles direct our Nominating/Corporate Governance Committee to take into account all factors it considers appropriate, including a candidate’s reputation for ethical business dealings, knowledge, skill, experience, expertise and the extent to which the candidate would fill a present need inand diversify the compositionviewpoints, background, experience, and other demographics of the Board.
•represent and assist the Board of Directors in discharging its oversight responsibility relating to human capital management, with particular emphasis on efforts related to diversity, equity, and inclusion as well as compensation matters, including determining the compensation arrangements for the Chief Executive Officer and reporting its determination to the Board of Directors for ratification by a majority of independent directors; and
•review and discuss with management the disclosure under the caption “Compensation Discussion and Analysis” and prepare the report of the Compensation Committee with respect to such disclosure, each of which is to be included in our annual proxy statement.
14
consultant, the Compensation Committee must consider the six independence factors set forth by the NYSE, as further discussed in “Executive Compensation — Compensation Discussion and Analysis” beginning on page 2218 of this proxy statement.
The
15
http://investor.ProAssurance.com/govdocs. The primary purposes of our Audit Committee are to represent and assist the Board of Directors in discharging its oversight responsibility relating to:
•the accounting, reporting and financial practices of ProAssurance and its subsidiaries, including the integrity of our financial statements;
•the surveillance of our administration and financial controls and compliance with legal and regulatory requirements;
•the outside auditor’s qualifications and independence;
•ProAssurance’s policies on risk assessment and risk management with respect to financial reporting issues;
•the performance of our internal auditors.
SEC.
•alter or repeal any resolution adopted by the Board of Directors that by its terms is not subject to amendment or repeal by the Executive Committee or any resolution relating to the establishment or membership of the Executive Committee;
•act with respect to matters required to be passed upon by the full Board of Directors, the independent directors, or by a committee comprised of independent directors; or
•act on any matter that has been delegated to the Audit Committee, the Nominating/Corporate Governance Committee or the Compensation Committee in their respective charters.
16
2021
| 2019 | 2018 | |||||||
Audit fees | $ | 2,319,575 | $ | 2,542,360 | ||||
Audit-related fees | 124,170 | 0 | ||||||
Tax fees | 399,865 | 140,000 | ||||||
All other fees | 0 | 0 | ||||||
|
|
|
| |||||
Total | $ | 2,843,610 | $ | 2,682,360 | ||||
|
|
|
| |||||
| 2022 | 2021 | ||||||||||
| Audit fees | $ | 4,326,225 | $ | 4,291,728 | |||||||
| Audit-related fees | — | 39,569 | |||||||||
| Tax fees | 493,921 | 346,845 | |||||||||
| All other fees | — | — | |||||||||
| Total | $ | 4,820,146 | $ | 4,678,142 | |||||||
17
subsequent guidance and interpretation of the regulatory and self-regulatory organizations applicable to ProAssurance, including without limitation, the SEC and the NYSE. The independent auditor may not provide anynon-audit services that are prohibited under the provisions of Section 10A of the Exchange Act and the rules and regulations promulgated thereunder.
•the Audit Committee believes would not impair the independence of the auditor; and
•are consistent with SEC rules on auditor independence.
18
or related work. The annual audit services are set forth in an engagement letter prepared by the independent auditor which is submitted to the Audit Committee for approval. The engagement letter provides that the independent auditor reports directly to the Audit Committee. Any audit services within the scope of the engagement letter are deemed to have beenpre-approved by our Audit Committee.
2023.
19
filings.
20
Based on the reports and discussions described in this report, and subject to the limitations on the role and responsibilities of the Audit Committee referred to above and in the charter, the Audit Committee recommended to the Board of Directors that the audited consolidated financial statements of ProAssurance for 20192022 be included in its Annual Report on Form10-K for the year ended December 31, 2019,2022, prior to the filing of such report with the SEC.
Kedrick D. Adkins Jr., C.P.A.
Bruce D. Angiolillo, J.D.
Frank A. Spinosa, D.P.M.
April 6, 2020
which such vote occurs every six years.
21
“street “street name” with your broker and you do not specifically instruct your broker how to vote on the advisory vote on executive compensation, your broker will not vote for you on Proposal 3 (Advisory Vote on Executive Compensation).

Overview
Our Named Executive Officers (“NEOs”) for 2022 were:
| Name | Title | ||||
| Edward L .Rand, Jr. | President and Chief Executive Officer | ||||
| Dana S. Hendricks | Executive Vice President and Chief Financial Officer | ||||
| Jeffrey P. Lisenby | Executive Vice President, General Counsel & Secretary | ||||
| Michael L. Boguski | President, Specialty Property Casualty Segment | ||||
| Kevin M. Shook | President, Workers’ Compensation Segment | ||||
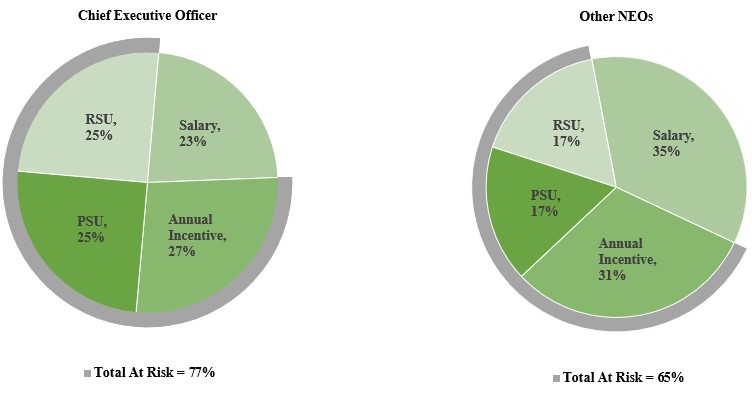
We emphasize incentive compensation that rewards our executives for the achievement of short-term and long-term strategic and operational goals. Our compensation program for executives contemplates a total compensation package that is competitive in the market. Our goal is to place a majority of our executives’ compensation relative to base salary at risk while at the same time avoiding the encouragement of unnecessary or excessive risk-taking. We establish performance measure targets for annual and long term incentive compensation which if earned will result in a majority of our executive compensation being at risk. In 2019, the “at risk” compensation (sum of annual incentive and three year average of long term incentive) received by our Chief Executive Officer was approximately 52.0% of total compensation and the “at risk” compensation received by our other executives ranged from approximately 40.2% to 59.7% of total compensation (sum of base salary, annual incentive and three year average of long term incentive). The percentage of “at risk” compensation was less in 2019 than in 2018 because the target performance measures used to determine incentive compensation were not met in 2019; as a result, the amount of incentive compensation received by the executives was a smaller portion of their compensation. The performance measures are established to reward performance and to link rewards to our strategic business objectives as follows:
Our annual Annual incentive compensation is intended to maximize the efficiency and effectiveness of our operations by providing compensation based on annualachievement of pre-defined performance measures formetrics by our executives.
Our long-term Long-term incentive compensation is intended to reward executives for executives is focused ondriving results that achieve long-term growth in stockholder value.
At the 2013 annual meeting, our stockholders approved the 2014 Annual Incentive Compensation Plan and the 2014 Amended and Restated Equity Incentive Plan to replace the 2008 Annual Incentive Compensation Plan and the 2008 Equity Incentive Plan. The Board of Directors recommended that these plans be approved by the stockholders so that performance-based compensation granted to our executives under our short term and long term incentive plans would qualify under Section 162(m) of the Internal Revenue Code of 1986, as amended (the “Code”) and so that the shares of our common stock issued as equity awards under these plans would be eligible
22
for listing on the New York Stock Exchange. All annual and long-term2022 incentive compensation grantedplans the consolidated combined ratio was 105.2%, which excludes the effects of certain non-operational items.
The incentive compensation of2021. In our Chief Executive Officer and other executive officers of ProAssurance is based on corporate-wide performance measures in recognition of their responsibility for overall performance of ProAssurance and its insurance subsidiaries. In 2017, 2018, and 2019, we operated several of our subsidiaries as separate operating divisions, including ProAssurance Indemnity Company, Inc., ProAssurance Casualty Company, ProAssurance Specialty Insurance Company, Inc. (“Healthcare Professional Liability Group” or “HCPL Group”); the Podiatry Insurance Company of America and its subsidiary, PACO Assurance Company, Inc. (the “PICA Group”); and Eastern Insurance Holdings, Inc. and its insurance subsidiaries (the “Eastern Group”). We considered the presidents of these operating divisions to be executive officers and based annual incentive compensation in part on performance measures tailored to their respective operating divisions. In conjunction with our release of 2018 earnings, we announced changes in our management structure that aligned executive management to our financial operating segments (“Segments”). The HCPL Group and the PICA Group are included in the Specialty P&C Segment (“Specialty P&C”) and the Eastern Group is included in the Workers’Worker’s Compensation Insurance Segmentsegment, the combined ratio was 99.9% in 2022 versus 101.5% the prior year, and theour Segregated Portfolio Cell Reinsurance segment recorded a combined ratio of 85.4% for 2022 versus 85.1% in 2021.
| Total Annual Incentive Achievement for Chief Executive Officer | 106.5% of target | ||||
| Total Annual Incentive Achievement for Corporate Executives | 101.5% of target | ||||
| Total Annual Incentive Achievement for Specialty P&C President | 99.8% of target | ||||
| Total Annual Incentive Achievement for Workers' Compensation President | 105.1% of target | ||||
| Total Achievement for 2020-22 LT Equity Incentive Grants | 0% of target | ||||
compensation program aligns with the interests of our stockholders and adheres to our pay for performance philosophy. When setting compensation for our executives, the Compensation Committee considers the results of the annual Say-on-Pay vote, the long-term vision and strategic goals of the Company, input from management, input from its independent compensation consultant, and investor engagement feedback. Our executive compensation program historically has received very strong stockholder support.
| Proxy Year | 2018 | 2019 | 2020 | 2021 | 2022 | ||||||||||||
| Favorable Vote | 98% | 98% | 87% | 96% | 97% | ||||||||||||
| What we do: | What we don’t do: | ||||
√ Annual say-on-pay vote √ Majority of pay at-risk or variable √ Balance metrics and measurement periods √ Annual engagement with stockholders √ Share ownership requirements √ Double-trigger cash severance agreements √ Clawback policy covering both cash and equity √ Minimum holding period for stock awards √ Risk assessment of pay √ Engage an independent compensation consultant | x Tax gross-ups in new executive agreements x Permit hedging by employees or directors x Excessive perquisites x Overlapping performance metrics x Stock option repricing x Pay dividends on unearned shares | ||||
| ProAssurance Peer Group for 2022 Compensation Decisions | ||||||||
| Amerisafe | Global Indemnity Group+ | State Auto Financial | ||||||
| Argo Group International Holdings | Horace Mann Educators | SiriusPoint | ||||||
| Assured Guaranty | James River Group Holdings | United Fire Group | ||||||
| Donegal Group | RLI | United Insurance Holdings | ||||||
| Employers Holdings | Safety Insurance Group | Universal Insurance Holdings | ||||||
| Erie Indemnity | Selective Insurance Group | White Mtns Insurance Group | ||||||
As required by rules enacted byfactors with the SECmost relevant being total assets, market capitalization, and total revenue, as follows (all figures as of year-end 2022):
| Factor | Total Assets | Market Cap | Revenue | ||||||||
Peer 75th Percentile | $9.3 billion | $3.6 billion | $1.6 billion | ||||||||
| Peer Median | $3.4 billion | $1.0 billion | $1.1 billion | ||||||||
Peer 25th Percentile | $2.4 billion | $0.7 billion | $0.8 billion | ||||||||
| ProAssurance | $5.7 billion | $0.9 billion | $1.1 billion | ||||||||
23
ProAssurance owns any shares of common stock of ProAssurance and none of them has had a relationship with any executive officer or director of ProAssurance.
With assistanceindependent members of our senior management, TCS compiled a list of peer companies, whichBoard. Our recommendation includes the Compensation Committee subsequently reviewedCEO’s base salary and approved, to be used as comparatorsopportunity for our executive compensation and compiled compensation data of the peer companies with respect to base salaries, annual incentive compensation and long-term incentive compensation. The peer companies are intended to represent organizations that compete with ProAssurance both for business and talent. TCS evaluated each elementindependent Board members unanimously approved all of our executive compensation in comparisonrecommendations with respect to the Chief Executive Officer’s compensation information compiled from the peer companies.
The companies used as our peer group to review 2019 compensation included 19 companies, namely: Alleghany Corporation; American National Insurance Company; AmTrust Financial Services, Inc.; ARCH Capital Group Ltd.; Argo Group, Inc.; Donegal Group, Inc.; Employers Holdings, Inc.; Erie Indemnity Company; Horace Mann Educators Corporation; Kemper Corporation; Markel Corporation; Mercury General Corporation; RLI Corp.; Safety Insurance Group, Inc.; Selective Insurance Group, Inc.; State Auto Financial Corporation; United Fire Group, Inc.; United Insurance Holdings Corp.; Universal Insurance Holdings; and W. R. Berkley Corporation. The 2019 peer group was substantially the same as the peer group used to review 2018 compensation except that AmTrust Financial Services, Inc. and The Navigators Group, Inc. were removed from the group, and Kemper and Universal Insurance Holdings were added to the group in 2019.
The specialty insurers included in the peer companies had total assets ranging from approximately $1.78 billion to approximately $33.3 billion with a median of approximately $5.4 billion at the end of 2018 as compared to ProAssurance’syear-end total assets of approximately $4.6 billion, and they had a market capitalization ranging from approximately $0.39 billion to approximately $14.4 billion with a median of approximately $2.9 billion at the end of 2018 as compared to ProAssurance’syear-end market capitalization of approximately $2.8 billion. The median revenues for all of the peer companies were approximately $1.8 billion as compared to ProAssurance’s revenue of approximately $886 million for the year ended December 31, 2018, and the median operating income (before income taxes) for the peer companies was approximately $67.7 million as compared to $79.5 million for ProAssurance for the year ended December 31, 2018.
In the course of its duties as our compensation consultant, TCS compiles data on executive compensation arrangements from the peer companies and provides us with a report that includes a summary of the compiled data and its observations and recommendations on the competitiveness of the elements of ProAssurance’s executive compensation (base salary, annual incentives and long-term incentives). Senior management provides the Committee information for use in developing recommendations on executive compensation in the following respects:
calculation of the incentive compensation payable to each of the senior executives in accordance with the performance criteria in the annual incentive award guidelines as approved by the Committee for that year;
review and analysis of the performance criteria for performance shares to be granted as long-term compensation in the current year in view of the long-term corporate goals and objectives;
calculation of the results of performance criteria and corresponding awards under maturing performance shares;
estimate of the value of equity compensation in accordance with generally accepted accounting principles in the United States;
analysis of the performance criteria in the annual incentive award guidelines for the current year in light of current corporate goals; and
analysis of the form and mix of the compensation elements included in our executive compensation.
The Chief Executive Officer recommends to the Compensation Committee the appropriate compensation for executive officers other than himself within the compensation framework established by the Committee.
24
The When making these recommendations, the Chief Executive Officer has access to the compensation consultant’s reports when making these recommendations. The Committee reviews these recommendations atreports. In a meeting usually heldseries of meetings conducted in February 2023, after the financial results of the prior year arewere reasonably certain. We receivecertain, the Committee reviewed the recommendations of the Chief Executive OfficerCEO together with supporting material and we review this information along with the report of the compensation consultant. After analyzing the information, we make our decisions and transmit them to the full board through the minutes of the Committee meeting. We accepted the recommendations of the Chief Executive OfficerCEO for the current year and all years covered in the Summary Compensation Table.
Senior management makes no recommendations with respect to The independent directors ratified our approval of the compensationCEO’s recommendations.
Chief Executive Officer
2022.
In 2013, our stockholders approved the ProAssurance Corporation 2014 Annual Incentive Compensation Plan. The plan is designed to permit annual incentive awards to qualify as performance-based compensation under Internal Revenue Code Section 162(m). Under Section 162(m), no federal income tax deduction was allowed for annual compensation in excess of $1 million paid to the Chief Executive Officer and other executives named in the Summary Compensation Table included in our proxy statement unless the excess compensation was performance-based compensation as defined in the Code and supporting regulations. The performance-based exception to the $1 million limit on the federal income tax deduction was eliminated by Tax Cuts and Jobs Act (TCJA) that was enacted on December 22, 2017, but the TCJA included an exception for awards paid under an agreement entered into on or prior to November 2, 2017. This change did not impact the annual incentive awards for 2017, which awards were paid under the 2014 Annual Incentive Plan. The annual incentive compensation for our Chief Executive Officer as reflected in the Summary Compensation Table was structured to qualify as
25
performance-based compensation under Section 162(m). The annual incentive award for our Chief Executive Officer for 20192022 was a cash$1,278,000. This amount was 127.8% of $305,100.
his annualized salary as of year-end 2022, versus target award of 120% of salary. The award was paid in cash.
Annual We establish annual incentive award targets, are establishedexpressed as a percentage of base salary, during the first quarter for the current year and are expressed as a percentage of base salary.year. Thus, the annual incentive compensation program assumes a base salary that is competitive in the market. The Compensation Committee establishesestablished target level annual incentive for each of our Named Executive Officers in 2022 as follows:
| 2022 Annual Incentive Target | |||||
| Officer | Target (% of Base Salary) | ||||
| Chief Executive Officer | 120% | ||||
| Chief Financial Officer | 90% | ||||
| Executive VP, General Counsel | 90% | ||||
| President, Specialty P&C | 100% | ||||
| President, Workers’ Comp | 90% | ||||
| 2022 Annual Incentive Payout Range | ||||||||
| Officer | Threshold (% of Base Salary) | Maximum (% of Base Salary) | ||||||
| Chief Executive Officer | 60% | 180% | ||||||
| Chief Financial Officer | 45% | 135% | ||||||
| Executive VP, General Counsel | 45% | 135% | ||||||
| President, Specialty P&C | 50% | 150% | ||||||
| President, Workers’ Comp | 45% | 135% | ||||||
The Compensation Committee assigns a weighted percentage for each of the performance goals. Annualgoals, and annual incentive awards are subject to an increase or decrease to the extent actual performance is greater or less than each target performance goal within a defined range of the performance goal as established by the Committee.performance. The Committee uses these weighted performance goals to determine the annual incentive award for the Chief Executive Officer. The Chief Executive Officer, and the CEO in turn recommends annual incentive awards for the other executives pursuant to the weighted performance goals establishedapproved by the Committee. The CEO’s recommendations of the Chief Executive Officerfor executives other than himself are subject to review and modification by the Committee. The Committee determinesconfirms that the goals and incentives are set at levels that are reasonable and consistent with past practice, relate to the sound financial management of ProAssurance, and do not involve unnecessary or excessive risk that would threaten the value of ProAssurance.
We have modified
In 2017, the exclusive performance measures for the annual incentive compensation of our Chief Executive Officer and Chief Financial Officer were Return on Equity,profitability. The Consolidated Combined Ratio and Gross Written Premium, in each case foris based on the consolidated results of ProAssurance and its consolidated subsidiaries. The annual incentive compensation forsubsidiaries, calculated by adding the President of the HCPL Group used these performance measures forone-half of his annual incentive compensation, and the remainingone-half of his annual incentive compensation was based on performance measures for the HCPL Group. For 2017, we modified the performance criteria for the President of the Eastern Group. For Eastern, we reduced the weight attributed to Eastern’s Combined Ratio to 37.5%, increased the weight attributed to Eastern’s Segregated Portfolio Cell Income to 7.5%, and added Eastern’s Direct Written Premium as a performance measure with percentage weight of 5%.
26
A summary of the weighted percentage for each of the 2017 performance criteria and the performance guidelines follows:
| Return on Equity | Consolidated Combined Ratio | Gross Written Premium | Operating Division Metrics | |||||
Corporate Executives | 15% | 70% | 15% | N/A | ||||
President HCPL Group | 7.5% | 35% | 7.5% | 50% | ||||
President Eastern Group | 7.5% | 35% | 7.5% | 50% |
Return on Equity — Return on equity (ROE) is a commonly used annual measure that measures profitability of a company by reflecting as a ratio the amount of earnings generated with the stockholders’ equity. We compute ROE by dividing annual net income by the average of beginning and ending stockholders’ equity.
Combined Consolidated Ratio — The combined ratio is included as a performance measure because it is a traditional measure of “bottom line” economic success for a property and casualty insurance company that does not directly equate to forecasting earnings if publicly disclosed. Our combined ratio is the sum of our loss ratio and the expense ratio, based on our GAAP annual income statement.
Gross Written Premium — This includes premiums from all lines of business.
In 2018, we retained the same performance measures and weighted percentages for our corporate executive officers and increased the value of the operating division metrics to 70%. The performance measures and the weighted percentages attributable to each of them for 2018 are shown below:
| Return on Equity | Consolidated Combined Ratio | Gross Written Premium | Operating Division Metrics | |||||
Corporate Executives | 15% | 70% | 15% | N/A | ||||
President HCPL Group | 4.5% | 21% | 4.5% | 70% | ||||
President Eastern Group | 4.5% | 21% | 4.5% | 70% |
The performance measures of the HCPL Group and their respective weighted percentages for 2018 are as follows: HCPL Combined Ratio — 38.5%, HCPL New Premiums — 7.7%, HCPL Retention — 11.9%, and HCPL Pricing —11.9%; the performance measures for Eastern Group and their respective weighted percentages are as follows: Eastern Combined Ratio — 52.5%, Eastern Segregated Portfolio Cell Income — 10.5%, and Eastern Direct Written Premium —7%.
For 2019, we created new categories and metrics for our annual incentive compensation. The exclusive performance measures for the annual incentive compensation of our corporate executives were Weighted Combined Ratio,determined in accordance with GAAP.
| Weighted Combined Ratio | Return on Equity | Expense Management | Return on Lloyd’s Investment | Segment Metrics | ||||||||||||||||
Corporate Executives | 60 | % | 15 | % | 15 | % | 10 | % | N/A | |||||||||||
President Workers’ Comp | 18 | % | 4.5 | % | 4.5 | % | 3 | % | 70% | |||||||||||
27
The new 2019 performance measures are described below:
Weighted Combined Ratio — The weighted combined ratio is the average combined ratio of the Specialty P&C and Workers’ Comp Segments weighted according to the written premiums in each Segment.
Expense Management — This performance measure focuses on the expense ratio contribution of corporate expenses. This is calculated as a ratio of Corporate Segment expenses (underwriting, policy acquisition, and operating expenses for the Corporate Segment) to consolidated net earned premium (excluding the Lloyd’s Segment).
Return on Lloyd’s Investment — This measure focuses on achieving an acceptable return on the Company’s capital commitment to the Lloyd’s Segment. This is calculated as a ratioeffect of net income of the Lloyd’s Segment toyear-end Funds At Lloyd’s (FAL) balance.
We established separateinvestment gains and losses.
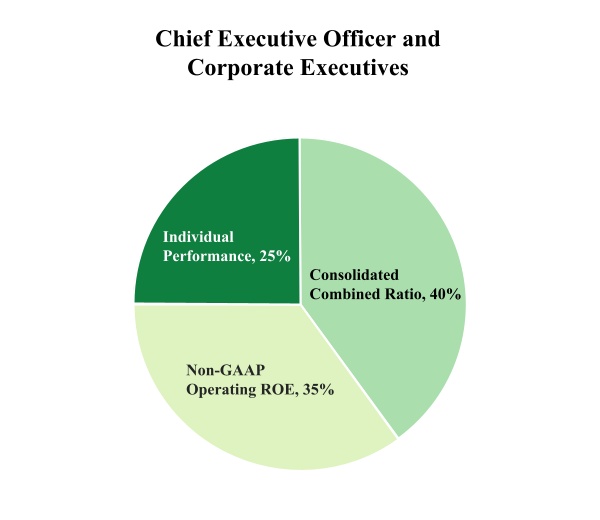
For 2020, we made further changes to the performance measures in recognition of market conditions that include increasing loss severity and associated increases in achievable loss ratio results. We kept Return on Equity and Expense Management as performance goals, but replaced other categories from 2019 with Loss Ratio Improvement and Individual Performance.
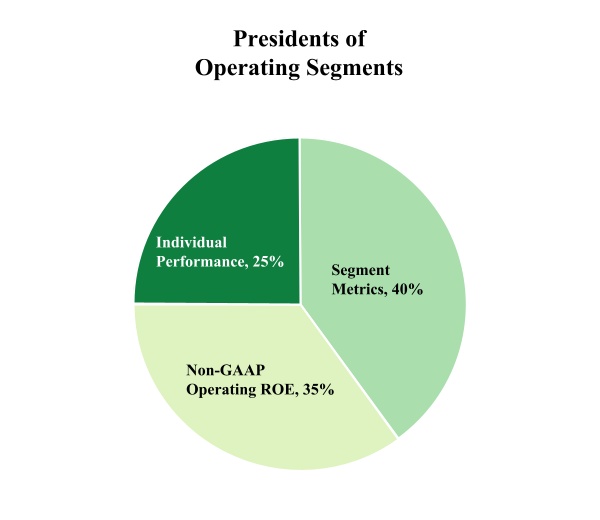
| Loss Ratio Improvement | Return on Equity | Expense Management | Individual Performance | Segment Metrics | ||||||||||||||||
Corporate Executives | 30 | % | 25 | % | 25 | % | 20 | % | N/A | |||||||||||
President of Segments | 9 | % | 7.5 | % | 7.5 | % | 6 | % | 70% | |||||||||||
The new performance measures are described below:
Loss Ratio Improvement — The loss ratio improvement goal focuses on year-over-year improvement in the consolidated ratio for the operating segments (excluding Lloyd’s).
Individual Performance — Executive officers will be subjectively evaluated on their overall performance, including an assessment of the overall quality of such officer’s performance,efforts, leadership effective,effectiveness, execution on strategic plans, and contribution to the success of the Company.
We established separate performance goals for our Specialty P&C segment and continue This element allows the Committee to use separateperform a holistic assessment of the individual contributions of each executive.
28
being attributed tocredit earned for that performance measure;measure, and performance above the maximum level for any performance measure is subject to a cap incapped at 150% of the percentageweight assigned to that measure.
For 2017,
| 2022 Annual Incentive Program – CEO | ||||||||||||||||||||
| Metric | Weighting | Threshold | Target(2) | Maximum | Actual Result | Weighted Achievement | ||||||||||||||
| Consolidated Combined Ratio | 40% | 110% | 106% | 98% | 105.2% | 42.0% | ||||||||||||||
| Non-GAAP Operating ROE | 35% | 1% | 2% | 8% | 1.9% | 33.3% | ||||||||||||||
| Individual Performance | 25% | (1) | (1) | (1) | 125.0% | 31.2% | ||||||||||||||
| Total Achievement | 106.5% | |||||||||||||||||||
| 2022 Strategic and Operational Achievements Supporting Individual Performance Awards | ||
| Written premiums exceeded $1 billion for the first time, driven by the continued successful integration of the NORCAL acquisition, significant rate gains in our renewed business, and strong customer retention. | ||
| We fully reopened our business offices with flexible post-pandemic work schedules for our employees. | ||
| We hired a program manager to focus on implementation of our plans related to Diversity, Equity, and Inclusion ("DE&I"), in furtherance of our goal to be the Employer of Choice for our industry. | ||
| Continued substantive progress on company-wide DE&I efforts. | ||
| Threshold | Target | Maximum | ||||||||||
CEO | 100 | % | 150 | % | 200 | % | ||||||
Corporate Executives (other than CEO) | 60 | % | 90 | % | 120 | % | ||||||
President Eastern Group | 60 | % | 90 | % | 120 | % | ||||||
President HCPL Group | 60 | % | 90 | % | 120 | % | ||||||
For 2018, the target incentive opportunity for our CEO and other officers stayed the same with the exception of our CFO who was promoted to Chief Operating Officer in January 2018. The target incentive opportunity for our Chief Operating Officer / CFO was set at Threshold — 70%, Target — 105%, and Maximum — 140%.
For 2019, the dollar value of those awards appears in the annual incentive compensation opportunities was reducedSummary Compensation Table on page 27 of this proxy statement:
| Executive | Achieved (% of Target) | Target (% of Salary) | Earned Award (% of Salary) | ||||||||
| Chief Executive Officer | 106.5% | 120% | 127.8% | ||||||||
| Chief Financial Officer | 101.5% | 90% | 91.4% | ||||||||
| EVP / General Counsel | 101.5% | 90% | 91.4% | ||||||||
| President Specialty P&C | 99.8% | 100% | 99.8% | ||||||||
| President Workers’ Comp | 105.1% | 90% | 94.6% | ||||||||
| Threshold | Target | Maximum | ||||||||||
CEO | 60 | % | 120 | % | 180 | % | ||||||
President / Chief Operating Officer | 60 | % | 120 | % | 180 | % | ||||||
Chief Financial Officer | 40 | % | 80 | % | 120 | % | ||||||
President Specialty P&C | * | * | * | |||||||||
President Workers’ Comp | 40 | % | 80 | % | 120 | % | ||||||
|
For 2020, the target incentive opportunitiesfollowing metrics will apply:
| Threshold | Target | Maximum | ||||||||||
CEO | 60 | % | 120 | % | 180 | % | ||||||
Chief Financial Officer | 45 | % | 90 | % | 135 | % | ||||||
President Specialty P&C | 15 | % | 30 | % | 45 | %* | ||||||
President Workers’ Comp | 45 | % | 90 | % | 135 | % | ||||||
|
Presidents of the operating segments)
29
based on our long-term objective of growth in stockholder value. The Compensation Committee has established award agreements for performance shares and RSUs in accordance with our 2014 Equity Incentive Plan that requires a three-year vesting period. Performance shares are earned if corporate value is enhanced through achievement of performance measures over the three-year vesting period. Further,RSUs promote retention and ownership of executive talent and strengthen alignment between executives and stockholders as the RSUs enhance executive retention asvalue realized by executives will have an incentiveis directly tied to remain employed during the three-year vesting period to obtain the RSUs even if we are not able to meet the long-term performance measures.
stock price performance.
period. Performance shares are based onpre-established performance criteria that must be achieved over a period of three years. Each executive is grantedgrant includes a target andlevel award along with a threshold award and maximum award expressed as a number of shares of our Common Stock.
Stock Performance (Total Return) — Stock performance is measured by total return in comparison to the SNL Property/Casualty Insurance Index, which is the index we have used to compare our performance to other public insurance companies. If performance is equal to the index, the minimum award is earned; if our stock performance is 10% greater than the index, the target award is achieved; and, if our stock performance is 20% greater than the index, the maximum award is achieved. If our stock performance is less than the index, no performance shares are awarded under this measure.
Consolidated Combined Ratio — The combined ratio measure is determined by using the weighted average of the GAAP consolidated combined ratio of ProAssurance and its subsidiaries for each of the calendar years in the performance period. If the average consolidated combined ratio is not above 96%, the target award is earned; if the average consolidated combined ratio is not more than 100%, then the threshold award is earned; and if the average consolidated combined ratio is not more than 90% (for 2018), and 92% (for 2019) the maximum award is earned.
The performance shares granted to the Presidents of our operating Segments are based on the same corporate-wide performance measures that we use for our Chief Executive Officer and other corporate executives, namely Stock Performance and Consolidated Combined Ratio.
For awards of 2020 performance shares, we eliminated the Consolidated Combined Ratio measure and replaced it with compound annual growth rateCompound Annual Growth Rate (CAGR) in book value per share (excluding adjustments for unrealized gains and losses, and further adjusting for stockholder dividends). Each measure contributes 50% to the final achieved award. A description of the two performance measures follows:
30
If both of the performance measures are achieved, performance shares are awarded based on the better result on the two measures during the performance period. Performance shares for resultsResults falling between the stated measures are interpolated. If an executive terminates employment prior to the expiration of the performance period by reason of retirement or resignation for “good reason” as defined in the award documents, a portion of the performance shares and RSUs granted in the calendar years ending before the termination of employment may be paid based on service during the performance period if the Committee finds that the performance criteria had been satisfied at the end of the year preceding termination of employment. Upon a change of control of ProAssurance or termination by reason of death or disability, performance shares are payable to executives at the target level.
Our grantslevel and RSUs are deemed fully earned. For all years shown in the Summary Compensation Table, the value of long-term incentive compensation in years priorequity awards is allocated approximately one-half to 2018 consisted of approximately two thirds performance shares and one third RSUs with the number of units of each depending upon the executive’s positionone-half to RSUs.
In 2018 we made two changes to our grants of long-term incentive compensation. Instead of granting twoBook Value for 2020-22.
Since 2014, long-term incentive compensation awards have been and will be granted under the 2014 Amended and Restated Equity Incentive Compensation Plan. The plan was designed so that options and performance shares granted to executives may qualify as performance-based compensation under Internal Revenue Code Section 162(m). RSUs will not qualify as performance-based compensation under Internal Revenue Code Section 162(m).
Officer.
Guidelines
31
common stock to comply with the Dodd-Frank Wall Street Reform and Consumer Protection Act, and we reviewed this policy to address the transactions identified in Item 407(i) of RegulationS-K for this year’s annual meeting now that the SEC has adopted final rules relating to Item 407(i). Because our existing anti-hedging policy is in line with the requirements in Item 407(i), we did not make any changes to the policy.Act. Our anti-hedging policy is contained in our Code of Ethics and Conduct available on our website, and is as follows: “[n]o employee or member of the Board of Directors is permitted to purchase financial instruments (such as prepaid variable forward contracts, equity swaps, collars, and exchange funds) that are designed to hedge or offset any decrease in the market value of the Company’s common stock that (1) have been granted to the employee or member of the board of directors as part of his or her compensation; or (2) are otherwise held, directly or indirectly, by the employee or member of the Board of Directors.”
2011 Stock Ownership Plan
On December 1, 2010,rules, our Board of Directors onwill make any necessary changes to the recommendationCompany's existing clawback policy to conform with the NYSE rules. Any such changes will be made within sixty (60) days of the Compensation Committee, adopted a stock purchase plan for employees and directors known as the ProAssurance Corporation Stock Ownership Plan (the “Stock Ownership Plan”).
Matching grants under the Stock Ownership Plan are issued to employees as awards of RSUs under the 2014 Amended and Restated Equity Incentive Plan. Shares purchased under the Stock Ownership Plan and shares issued pursuant to the RSUs awarded as matching grants under the plan will be paid from the shares reserved under the 2014 Amended and Restated Equity Incentive Plan.
In 2017, the Board of Directors terminated the Stock Ownership Plan effective on the later of October 1, 2020 or the date that all grant units held under the plan have been paid or forfeited, under the following terms: participants were allowed to make cash deposits until September 30, 2017; such cash deposits were used to purchase shares on the purchase date immediately following September 30, 2017; the right to participate in the Stock Ownership Plan was suspended on October 1, 2017; and all unvested grant units held under the plan will continue to be held and ultimately paid out in accordance with the termsEffective Date of the plan. We paid the final year of matching grants one year early in October 2019, so there are no unpaid, unvested awards. As a result, the Stock Ownership Plan was deemed terminated effective October 2019.
NYSE rule.
32
Post-termination and Change of Control Compensation
The termsControl” on page 32 of thethis proxy statement.
In accordance with the
As One of our Named Executive Officers, who is not the CEO, has a result ofseverance agreement dated January 1, 2008 that includes apre-existing agreements, we are currently required to reimburse certain executives for the excise tax that is payable by the executives if the severance benefits paid after a change of control are deemed to be “excess parachute payments” under Internal Revenue Code Section 280G. Although the severance benefits payable after a change of control for our executives are substantially below the threshold of three times annual compensation, the calculation of severance benefits for purposes of Internal Revenue Code Section 280G includes the value of benefits accelerated on a change of control under other compensation arrangements. The Retention and Severance Compensation agreements executed since 2010, including those executed in connection with the acquisition of Eastern, do not include either an obligation to reimburse the executives for the
33
excise tax under Internal Revenue Code Sections 280G and 4999 or a “single trigger” for severance compensation on a change of control.
Robert E. Flowers,
Bruce D. Angiolillo, J.D.
Thomas A. S. Wilson, Jr., M.D.
April 6, 2020
| ||||||||||||||||||||||||||||||||||||
|
|
|
|
|
|
|
|
|
| |||||||||||||||||||||||||||
|
|
|
|
|
|
|
|
|
| |||||||||||||||||||||||||||
|
|
|
|
|
|
|
|
|
| |||||||||||||||||||||||||||
|
|
|
|
|
|
|
|
|
| |||||||||||||||||||||||||||
|
|
|
|
|
|
|
|
|
| |||||||||||||||||||||||||||
|
34
| Name and Principal Position | Year | Salary ($) | Bonus(2) ($) | Stock Awards(3)(4) ($) | Option Awards ($) | Non-Equity Incentive Plan Compensation(5) ($) | Change in Pension Value and Nonqualified Deferred Compensation Earnings ($) | All Other Compensation(6) ($) | Total ($) | |||||||||||||||||||||||
| Edward L. Rand, Jr. | 2022 | 987,499 | — | 2,000,000 | — | 1,278,000 | — | 101,633 | 4,367,132 | |||||||||||||||||||||||
Chief Executive Officer and President(1) | 2021 | 937,696 | — | 949,998 | — | 1,182,718 | — | 79,163 | 3,149,575 | |||||||||||||||||||||||
| 2020 | 920,769 | — | 950,000 | — | 528,390 | — | 91,566 | 2,490,725 | ||||||||||||||||||||||||
| Dana S. Hendricks | 2022 | 471,385 | — | 450,000 | — | 433,913 | — | 45,185 | 1,400,483 | |||||||||||||||||||||||
| Chief Financial Officer, Treasurer and Executive Vice President | 2021 | 421,539 | 50,000 | 349,977 | — | 363,051 | — | 40,840 | 1,225,407 | |||||||||||||||||||||||
| 2020 | 394,231 | — | 250,024 | — | 171,200 | — | 40,408 | 855,863 | ||||||||||||||||||||||||
| Jeffrey P. Lisenby | 2022 | 508,063 | — | 450,000 | — | 465,885 | — | 39,311 | 1,463,259 | |||||||||||||||||||||||
| Executive Vice President, Corporate Secretary and General Counsel | 2021 | 456,549 | 50,000 | 399,981 | — | 389,888 | — | 35,519 | 1,331,937 | |||||||||||||||||||||||
| 2020 | 441,346 | — | 399,986 | — | 190,995 | — | 46,808 | 1,079,135 | ||||||||||||||||||||||||
| Michael L. Boguski | 2022 | 707,092 | — | 500,000 | — | 708,225 | — | 48,258 | 1,963,575 | |||||||||||||||||||||||
| President, Specialty P&C | 2021 | 632,212 | 367,188 | 424,983 | — | 353,949 | — | 45,758 | 1,824,090 | |||||||||||||||||||||||
| 2020 | 622,693 | 437,500 | 424,970 | — | 46,875 | — | 68,455 | 1,600,493 | ||||||||||||||||||||||||
| Kevin M. Shook | 2022 | 463,609 | — | 450,000 | — | 439,634 | — | 45,616 | 1,398,859 | |||||||||||||||||||||||
| President, Workers’ Compensation Insurance | 2021 | 427,375 | — | 399,981 | — | 400,427 | — | 41,132 | 1,268,915 | |||||||||||||||||||||||
| 2020 | 419,615 | — | 399,986 | — | 348,562 | — | 48,445 | 1,216,608 | ||||||||||||||||||||||||
|
|
|
|
|
|
35
|
| Qualified Retirement Plan ($) | Nonqualified Deferred Compensation Plan ($) | Bonus and Service Awards ($) | Perquisites ($) | |||||||||||||
Edward L. Rand, Jr. | 28,000 | 26,000 | — | 52,055 | ||||||||||||
Dana S. Hendricks | 28,000 | — | — | 126,612 | ||||||||||||
W. Stancil Starnes | 28,000 | 70,386 | — | 67,348 | ||||||||||||
Michael L. Boguski | 28,000 | 19,812 | 200,000 | 241,895 | ||||||||||||
Kevin M. Shook | 28,000 | 8,060 | 100,000 | 16,964 | ||||||||||||
2021; and $125,012 in 2020; Mr. Lisenby — $225,000 in 2022; $199,981 in 2021; and $199,993 in 2020; Mr. Boguski — $250,000 in 2022; $212,483 in 2021; and $212,485 in 2020; and Mr. Shook — $225,000 in 2022; $199,981 in 2021; and $199,993 in 2020; . The amounts do not correspond to actual value that will be recognized by the Named Executive Officers which depends on the market price of a share of Common Stock at the end of the vesting period.
| Qualified Retirement Plan | Nonqualified Deferred Compensation Plan | Bonus and Service Awards | Perquisites | ||||||||||||||||||||
| ($) | ($) | ($) | ($) | ||||||||||||||||||||
| Edward L. Rand, Jr. | $ | 15,250 | $ | 34,125 | — | $ | 52,258 | ||||||||||||||||
| Dana S. Hendricks | $ | 15,250 | $ | 7,500 | — | $ | 22,435 | ||||||||||||||||
| Jeffrey P. Lisenby | $ | 15,250 | $ | 10,153 | — | $ | 13,908 | ||||||||||||||||
| Michael L. Boguski | $ | 15,250 | $ | 20,105 | — | $ | 12,903 | ||||||||||||||||
| Kevin M. Shook | $ | 15,250 | $ | 7,930 | — | $ | 22,435 | ||||||||||||||||
The other compensation for Mr. Boguski and Mr. Shook includes $200,000 and $100,000, which consisted of the third and final year of payment of each executive’s noncompetition payout pursuant to retention agreements we entered into when we acquired Eastern in 2014. The terms of each executive’s agreement are described under the caption “Employment and Severance Agreements” on page 42 of this proxy statement.
Name | Estimated Possible Payouts UnderNon-Equity Incentive Plan Awards(2) | Estimated Future Payments Under Equity Incentive Plan Awards(3) | All Other Stock Awards; Number of Shares of Stock or Units(4) (#) | All Other Option Awards: Number of Securities Underlying Options (#) | Exercise or Base Price of Option Awards ($/Sh) | Grant Date Fair Value of Stock and Option Awards ($) | ||||||||||||||||||||||||||||||||||||||
| Grant Date(1) | Threshold ($) | Target ($) | Maximum ($) | Threshold (#) | Target (#) | Maximum (#) | ||||||||||||||||||||||||||||||||||||||
Edward L. Rand, Jr. | | 2/22/19 2/22/19 2/22/19 |
| | — — — |
| | — — — |
| | 305,100 — — |
| | — 2,860 — |
| | — 5,720 — |
| | — 11,440 — |
| | — — 5,721 |
| | — — — |
| | — — — |
| | — 249,964 250,008 |
| |||||||||||
| 7/1/19 | — | — | — | — | — | — | 55,127 | — | — | 1,999,993 | ||||||||||||||||||||||||||||||||||
Dana S. Hendricks | | 2/22/19 2/22/19 2/22/19 |
| | — — — |
| | — — — |
| | 84,750 — — |
| | — 858 — |
| | — 1,716 — |
| | — 3,432 — |
| | — — 1,716 |
| | — — — |
| | — — — |
| | — 74,989 74,989 |
| |||||||||||
W. Stancil Starnes | | 2/22/19 2/22/19 2/22/19 |
| | — — — |
| | — — — |
| | 164,775 — — |
| | — 2,860 — |
| | — 5,720 — |
| | — 11,440 — |
| | — — 5,721 |
| | — — — |
| | — — — |
| | — 249,964 250,008 |
| |||||||||||
Michael L. Boguski | | 2/22/19 2/22/19 2/22/19 |
| | — — — |
| | — — — |
| | 615,000 — — |
| | — 2,288 — |
| | — 4,576 — |
| | — 9,152 — |
| | — — 27,460 |
| | — — — |
| | — — — |
| | — 199,971 1,200,002 |
| |||||||||||
Kevin M. Shook | | 2/22/19 2/22/19 2/22/19 |
| | — — — |
| | — — — |
| | 260,760 — — |
| | — 1,573 — |
| | — 3,146 — |
| | — 6,292 — |
| | — — 5,435 |
| | — — — |
| | — — — |
| | — 137,480 237,510 |
| |||||||||||
36
|
(1)All awards were recommended by the Compensation Committee at its meeting on February 16, 2022, with a specified valuation date of February 22, 2022 (the date on which the window for the trading in ProAssurance common stock opened after the prior year-end earnings were released). As required by the Compensation Committee Charter, the independent directors approved the recommendation for the awards granted to the Chief Executive Officer at the meeting of the Board of Directors on March 2, 2022, and the Board of Directors also approved the recommendations for the awards granted to the other Named Executive Officers. (2)The amount reported represents the actual amounts paid to the | |||||||||||||||||||||||||||||||||||||||||||||||||||||||||||||||||||||||||||||||||||||||||||||||||||||||||||||||||||||||||||||||||||||||||||||||||||||||||||||||||||||||||||||||||||||||||||||||||||||||||||||||||||||||||||||||||||||||||||||||||||||||||||||||||||||||||||||||||||||||||||||||||||||||||||||||||||||||||||||||||||||||||||||||||||||||||||||||||||||||||||||||||||||||||||||||||||||||||||||||||||||||||||||||||||||||||||||||||||||||||||||||||||||||||||||||||||||||||||||||||||||||||||||||||||||||||||||||||||||||||||||||||||||||||||||||||||||||||||||||||||||||||||||||||||||||||||||||||||||||||||||||||||||||||||||||||||||||||||||
|
|
We have awarded equity compensation to our Named Executive Officers underfor annual incentive compensation for 2022. The Compensation Committee uses certain performance criteria as a guideline in making its recommendations for annual incentive compensation. Each element of the performance criteria has a minimum achievement level. No incentive compensation is payable with respect to an individual performance criteria if a minimum is not achieved. The non-equity incentive plan awards are discussed in more detail in the following equitydiscussion.
and are discussed in more detail in the following discussion. Mr. Rand received stock awards pursuant to his employment agreement when he became our CEO, which awards were approved by the independent directors.
On December 1, 2010, the Board of Directors, on the recommendation of the Compensation Committee, adopted the 2011 Stock Ownership Plan. More information about the 2011 Stock Ownership Plan is described above in this proxy statement in Note 2 to the Summary Compensation Table. The Board of Directors terminated the 2011 Stock Ownership Plan after giving effect to purchases and grants made in October 2017. Outstanding RSUs granted under the plan are subject to vesting or forfeiture in accordance with their terms.
37
if the performance is between the threshold and the target, or between the target and the maximum. The performance measures for Mr. Starnes,Rand, Ms. Hendricks, and Mr. Rand and Ms. HendricksLisenby are based exclusively on corporate-wide performance. For Mr. Boguski and Mr. Shook, 30%60% of their performance measures are based on corporate wide performance with the remaining 70%40% being based on performance measures relating to their respective operating division, the Specialty P&C in the case of Mr. Boguski and Workers’ Compensation in the case of Mr. Shook. The targets for annual incentive compensation for each of the Named Executive Officers for 20192022 and the performance measures and their assigned percentages are described under “Executive Compensation — Annual—Annual Incentive Compensation” beginning on page 2522 of this proxy statement. The threshold, target and maximum goals for each of the performance criteria in 20192022 and the credit given for each of the corporate performance criteria are set forth below.
| Performance | Credit | |||||||||||||||
Performance Criteria | 2019 Threshold | 2019 Target | 2019 Maximum | 2019 Actual | 2019 Target Percentage(1) | 2019 Weighted Percentage(2) | ||||||||||
Return on Equity | 3.5% | 5.4% | 9.0% | -3.9% | 15% | 0% | ||||||||||
Weighted Combined Ratio | Not above 100% | 95.9% | 91.8% | 120.9% | 60% | 0% | ||||||||||
Expense Management | 3.4% | 3.1% | 2.8% | 2.5% | 25% | 35% | ||||||||||
Specialty P&C | ||||||||||||||||
Combined Ratio | Not above 100% | 96.0% | 90.0% | 130.8% | N/A | N/A | ||||||||||
Expense Ratio | 0.5pts | 1.25pts | 2.0pts | +1.5% | N/A | N/A | ||||||||||
Gross Written Premium | $545 million | $565 million | $590 million | $577.7 | N/A | N/A | ||||||||||
Eastern | ||||||||||||||||
Combined Ratio | Not above 100% | 95.9% | 85.9% | 92.3% | 70% | 82.6% | ||||||||||
SPC Income | $1.7 million | $3.0 million | $4.2 million | $2.2 million | 15% | 10.2% | ||||||||||
Direct Written Premium | $267.5 million | $283.5 million | $295.3 million | $273.5 million | 10% | 5.8% | ||||||||||
Direct WrittenPremium-ESR | $7.0 million | $9.5 million | $12.0 million | $7.5 million | 5% | 3.0% | ||||||||||
|
|
| Performance | Credit | ||||||||||||||||||||||
Performance Criteria | 2022 Threshold | 2022 Target | 2022 Maximum | 2022 Actual | 2022 Target Percentage(1) | 2022 Achieved Percentage(2) | |||||||||||||||||
| Non-GAAP Operating Return on Equity | 1.0 | % | 2.0 | % | 8.0 | % | 1.9 | % | 35 | % | 33.3 | % | |||||||||||
| Consolidated Combined Ratio | 110 | % | 106 | % | 98 | % | 105.2 | % | 40 | % | 42.0 | % | |||||||||||
Individual Performance (CEO)(3) | — | % | — | % | — | % | 125 | % | 25 | % | 31.2 | % | |||||||||||
Individual Performance (other NEOs)(3) | — | % | — | % | — | % | 105 | % | 25 | % | 26.2 | % | |||||||||||
| Specialty P&C | |||||||||||||||||||||||
| Combined Ratio | 110 | % | 106 | % | 98 | % | 106.4% | (4) | 20 | % | 19.0%(5) | ||||||||||||
| Gross Written Premium | $ | 780.0 | M | $ | 821.5 | M | $ | 860.0 | M | $ | 826.3 | M | (4) | 20 | % | 21.2 | % | ||||||
| Workers’ Compensation | |||||||||||||||||||||||
| Combined Ratio | 103 | % | 98 | % | 88 | % | 96.8 | % | (6) | 30 | % | 31.8%(7) | |||||||||||
| SPC Income | $ | 1.1 | M | $ | 2.0 | M | $ | 2.8 | M | $ | 2.4 | M | 10 | % | 12.4 | % | |||||||
The Annual Incentives Awards were paid in cash, except that Ms. Hendricks received 7,541 shares.
A performance share is the equivalent of one share of Common Stock which becomes vested andnon-forfeitable upon the attainment of performance objectives established by the Compensation Committee. The Compensation Committee establishes the performance objectives and the length of the performance period to attain such objectives at the time a performance share is awarded. The Compensation Committee may prescribe different conditions for different participants, but the performance objectives for performance shares awarded to a participant must relate to at
38
least one of the objective criteria listed in the plan. Such criteria may be based on the performance of ProAssurance or a subsidiary or a business Segment (either alone or on a comparative basis relative to other companies). The Compensation Committee determines whether the performance objectives for performance shares have been attained at the end of each participant’s performance period, or if one or more interim periods are authorized by the Compensation Committee, at the end of an interim period within the relevant performance period. If the Compensation Committee determines that such performance objectives have been obtained, the participant will be entitled to receive payment for each performance share in an amount equal to the value of one share of our Common Stock on the date of payment. In 2019,2022, the Board of Directors, on the recommendation of the Compensation Committee, granted performance shares to the Named Executive Officers. The performance criteria are described in the discussion under “Executive Compensation — Long-term Incentive Compensation” on page 2924 of this proxy statement. The performance shares are payable if any of the performance criteria are met during the three year period ending December 31, 2021,2024, except that performance shares are payable at the target level upon the participant’s death or disability and are payable upon the participant’s retirement or termination for good reason after the year of grant if the performance level has been achieved for the last year prior to the participant’s termination with such award to be prorated based on the time the participant is employed during the performance period.
| Option Awards | Stock Awards | |||||||||||||||||||||||||||||||||||||||||||
| Name | Number of Securities Underlying Unexercised Options (#) Exercisable | Number of Securities Underlying Unexercised Options (#) Unexercisable | Equity Incentive Plan Awards Number of Securities Unearned Options (#) | Option Exercise Price ($) | Option Expiration Date | Number of Shares or Units That Have Not Vested (#)(1) | Market Value of Shares or Units of Stock That Have Note Vested ($) | Equity Inventive Plan Awards; Number of Unearned Shares, Units or Other Rights That Have Not Vested (#)(2) | Equity Incentive Plan Awards: Market or Payout Value of Unearned Shares, Units or Other Rights That Have Not Vested ($) | |||||||||||||||||||||||||||||||||||
| Edward L. Rand, Jr. | — | — | — | — | — | 7/1/2019 | - | 55,157 | 963,593 | 7/1/2019 | - | — | — | |||||||||||||||||||||||||||||||
| — | — | — | — | — | 2/21/2020 | - | 14,526 | 253,769 | 2/21/2020 | - | 14,526 | 253,769 | ||||||||||||||||||||||||||||||||
| — | — | — | — | — | 2/23/2021 | - | 19,301 | 337,188 | 2/23/2021 | - | 19,301 | 337,190 | ||||||||||||||||||||||||||||||||
| — | — | — | — | — | 2/22/2022 | - | 40,371 | 705,289 | 2/22/2022 | - | 40,371 | 705,289 | ||||||||||||||||||||||||||||||||
| Dana S. Hendricks | — | — | — | — | — | 2/21/2020 | - | 3,823 | 66,788 | 2/21/2020 | - | 3,823 | 66,788 | |||||||||||||||||||||||||||||||
| — | — | — | — | — | 2/23/2021 | - | 7,110 | 124,212 | 2/23/2021 | - | 7,111 | 124,228 | ||||||||||||||||||||||||||||||||
| — | — | — | — | — | 2/22/2022 | - | 9,084 | 158,690 | 2/22/2022 | - | 9,084 | 158,690 | ||||||||||||||||||||||||||||||||
| Jeffrey P. Lisenby | — | — | — | — | — | 2/21/2020 | - | 6,116 | 106,847 | 2/21/2020 | - | 6,116 | 106,847 | |||||||||||||||||||||||||||||||
| — | — | — | — | — | 2/23/2021 | - | 8,126 | 141,961 | 2/23/2021 | - | 8,127 | 141,975 | ||||||||||||||||||||||||||||||||
| — | — | — | — | — | 2/22/2022 | - | 9,084 | 158,690 | 2/22/2022 | - | 9,084 | 158,690 | ||||||||||||||||||||||||||||||||
| Michael L. Boguski | — | — | — | — | — | 2/21/2020 | - | 6,498 | 113,520 | 2/21/2020 | - | 6,498 | 113,520 | |||||||||||||||||||||||||||||||
| — | — | — | — | — | 2/23/2021 | - | 8,634 | 150,836 | 2/23/2021 | - | 8,635 | 150,848 | ||||||||||||||||||||||||||||||||
| — | — | — | — | — | 2/22/2022 | - | 10,093 | 176,322 | 2/22/2022 | - | 10,093 | 176,322 | ||||||||||||||||||||||||||||||||
| Kevin M. Shook | — | — | — | — | — | 2/21/2020 | - | 6,116 | 106,847 | 2/21/2020 | - | 6,116 | 106,847 | |||||||||||||||||||||||||||||||
| — | — | — | — | — | 2/23/2021 | - | 8,126 | 141,961 | 2/23/2021 | - | 8,127 | 141,975 | ||||||||||||||||||||||||||||||||
| — | — | — | — | — | 2/22/2022 | - | 9,084 | 158,690 | 2/22/2022 | - | 9,084 | 158,690 | ||||||||||||||||||||||||||||||||
Performance Shares and RSUs are
39
OUTSTANDING EQUITY AWARDS AT FISCALYEAR-END
| ||||||||||||||||||||||||||
|
|
|
|
|
|
|
|
|
| |||||||||||||||||
|
|
|
|
|
|
|
|
|
| |||||||||||||||||
|
|
|
|
|
|
|
|
|
| |||||||||||||||||
|
|
|
|
|
|
|
|
|
| |||||||||||||||||
|
|
|
|
|
|
|
|
|
| |||||||||||||||||
|
|
40
OPTION EXERCISES AND STOCK VESTED(1)
| ||||||||||||||||
|
|
|
| |||||||||||||
|
|
|
| |||||||||||||
|
|
|
| |||||||||||||
|
|
|
| |||||||||||||
|
|
|
| |||||||||||||
|
|
| Option Awards | Stock Awards | |||||||||||||||||||||||||
| Name | Number of Shares Acquired on Exercise (#) | Value Realized on Exercise ($) | Number of Shares Acquired on Vesting (#) | Value Realized on Vesting ($) | ||||||||||||||||||||||
| Edward L. Rand, Jr. | — | — | — | (1) | — | |||||||||||||||||||||
| 5,721 | (2) | 141,709 | ||||||||||||||||||||||||
| Dana S. Hendricks | — | — | — | (1) | — | |||||||||||||||||||||
| 1,716 | (2) | 42,505 | ||||||||||||||||||||||||
| Jeffrey P. Lisenby | — | — | — | (1) | — | |||||||||||||||||||||
| 4,291 | (2) | 106,288 | ||||||||||||||||||||||||
| Michael L. Boguski | — | — | — | (1) | — | |||||||||||||||||||||
| 27,460 | (2) | 680,184 | ||||||||||||||||||||||||
| Kevin M. Shook | — | — | — | (1) | — | |||||||||||||||||||||
| 5,435 | (2) | 134,625 | ||||||||||||||||||||||||
Name | Executive Contributions in Last FY ($) | Registrant Contributions in Last FY ($)(1) | Aggregate Earnings in Last FY ($) | Aggregate Withdrawals/ Distributions ($) | Aggregate Balance at Last FYE ($) | |||||||||||||
Edward L. Rand, Jr. | 26,000 | 26,000 | 279,971 | — | 1,383,604 | |||||||||||||
Dana S. Hendricks | — | — | — | — | — | |||||||||||||
W. Stancil Starnes | 71,526 | 70,386 | 549,590 | — | 2,630,845 | |||||||||||||
Michael L. Boguski | 19,812 | 19,812 | 34,126 | — | 227,318 | |||||||||||||
Kevin M. Shook | 8,060 | 8,060 | 16,256 | — | 99,333 | |||||||||||||
|
| Name | Executive Contributions in Last FY ($) | Registrant Contributions in Last FY ($)(1) | Aggregate Earnings in Last FY ($) | Aggregate Withdrawals/ Distributions ($) | Aggregate Balance at Last FYE ($) | ||||||||||||
| Edward L. Rand, Jr. | 61,490 | 34,125 | (360,647) | — | 1,919,760 | ||||||||||||
| Dana S. Hendricks | 7,500 | 7,500 | (5,333) | — | 38,846 | ||||||||||||
| Jeffrey P. Lisenby | 10,161 | 10,153 | (97,421) | — | 458,762 | ||||||||||||
| Michael L. Boguski | 22,100 | 20,105 | (61,344) | — | 365,773 | ||||||||||||
| Kevin M. Shook | 8,060 | 7,930 | (29,059) | — | 153,361 | ||||||||||||
41
Deferred amounts are contributed to the Deferred Compensation Plan and contributions are credited with deemed investment earnings as if they were invested in one or more designated mutual funds pursuant to an investment election made by the participants as of the date of deferral. Distributions under the plan are made upon termination of employment or service, death, disability, or upon a change of control. Distributions are made in a lump sum or annual installments over a period not exceeding 10 years as elected by the participant. A separate distribution election can be made with respect to each year’s deferrals and matching contributions.
•a term expiring July 1, 2024, with one year renewal periods if the agreement is not terminated;
•a minimum base salary of $900,000 subject to annual increases at the discretion of the Board of Directors;
•annual incentive compensation with a target level not less than 120% of base salary, to be based on performance criteria established by the Board of Directors consistent with the criteria for other senior executive officers;
•one-time award of restricted stock units with a grant date value of not less than $2 million to vest over five years;
•perquisites consistent with those provided to the prior Chief Executive Officer, including without limitation, up to 50 hours of personal use on the corporate airplane; and
•severance payments upon a termination of employment and payments upon a change of control as discussed in more detail under the caption “Payments on Termination and Change of Control.”
W. Stancil Starnes served as our Chief Executive Officer from July 1, 2007 to June 30, 2019, and now serves as our Executive Chairman. Mr. Starnes agreed to terminate his employment agreement upon his resignation as Chief Executive Officer. As a result, Mr. Starnes surrendered the following rights and benefits under that agreement:
a term expiring May 31, 2022;
a minimum base salary of $750,000 subject to annual increases at the discretion of the Board of Directors;
annual incentive compensation based on performance criteria established by the Board of Directors consistent with the criteria for other senior executive officers;
annual grant of equity compensation having an aggregate value of at least $500,000 based on the method ProAssurance uses to calculate compensation expense with respect to such awards for financial reporting purposes;
perquisites consistent with those provided to the prior Chief Executive Officer, including without limitation, up to 50 hours of personal use on the corporate airplane; and
severance payments upon a termination of employment and payments upon a change of control.
We entered into a Release and Severance Compensation Agreement with Dana S. Hendricks, our Chief Financial Officer, effective September 1, 2018, with Jeffrey P. Lisenby, our General Counsel, effective January 1, 2008, and with Kevin M. Shook, President of Workers’ Compensation, effective May 13, 2019, botheach of which provide for severance payments upon a termination of employment and payments upon a change of control, as discussed in more detail under the caption “Payments on Termination and Change of Control.”
42
In connection with our acquisition of Eastern Insurance Holdings, Inc. on January 1, 2014, we agreed to pay Michael L. Boguski a retention bonus in total amount of $1,200,000 payable in four equal installments of $300,000 with each installment payment being conditioned upon his employment on the installment payment date. Similarly, we agreed to pay Mr. Shook a retention bonus in total amount of $600,000 payable in four installments as follows — $100,000 in each of the first two years of employment, and $200,000 in each of the next two years of employment. We have paid both Mr. Boguski and Mr. Shook all four installments. Mr. Boguski and Mr. Shook each also agreed to a covenant not to compete that prohibits them from competing with Eastern’s workers’ compensation insurance business for three years after termination of employment (reduced to two years after the initial term). In exchange for the covenant not to compete, Mr. Boguski was entitled to an additional sum of $600,000 payable in monthly installments during the three years following the initial term, subject to forfeiture only if Mr. Boguski’s employment was terminated for cause during the payment period or he violated the noncompetition covenant. Through December 31, 2019, we have paid Mr. Boguski the total sum of $600,000 toward the compensation for his noncompetition covenant; therefore, there are no remaining payments to be made. Mr. Shook was entitled to an additional sum of $300,000 payable in monthly installments during the three years following the initial term, subject to forfeiture only if Mr. Shook’s employment was terminated for cause during the payment period or he violated the noncompetition covenant. Through December 31, 2019, we have paid Mr. Shook the total sum of $300,000 toward the compensation for his noncompetition covenant; therefore, there are no remaining payments to be made.
As a result of of Mr. Boguski’s new duties as President of our Specialty P&C Segment effective May 13, 2019, we entered into a new agreement providing that his annualnon-equity incentive compensation target will be set at 100% of base salary, and payment of an award in that amount was guaranteed for 2019. For 2020 and 2021, a portion of the annual incentive award will be guaranteedwas in the form of a contractual bonus and the remainder will bewas based on achievement of performance metrics established by our Compensation Committee. For 2022 and after, the annual incentive award will beis based entirely based on achievement of annual performance metrics. In addition, Mr. Boguski received aone-time equity compensation grant with a three-year vesting period and grant-date value of $1,000,000.
The Retention and Severance Compensation Agreement with Mr. Boguski includes an obligation to pay severance compensation if we terminate Mr. Boguskiis doubled for termination of employment by ProAssurance without cause or he terminates for good reason.
43
The amount of severance compensation is equal toby the sum of his annual base salary and average incentive compensation over the last three years plus any unpaid consideration for his covenant not to compete which is described above. Mr. Boguski will be entitled to two times the sum of his annual base salary and average incentive compensation if he terminates his employmentExecutive for good reason or he is terminated without cause within two years after afollowing change of control, and he isin control.
termination of employment under various scenarios as of December 31, 2022.
44
| Retirement or Voluntary Termination | Death or Disability | Involuntary Termination(1) | Involuntary Termination After Change of Control(1) | Change of Control | ||||||||||||||||
| $ | $ | $ | $ | $ | ||||||||||||||||
Edward L. Rand, Jr. | ||||||||||||||||||||
Cash Severance-Annual Salary | — | — | 1,800,000 | 1,800,000 | — | |||||||||||||||
Cash Severance-Average Annual Incentive | — | — | 2,160,000 | 2,160,000 | — | |||||||||||||||
Equity Compensation Vesting(2) | 927,154 | 3,012,992 | 927,154 | 3,012,992 | 3,012,992 | |||||||||||||||
Deferred Compensation(3) | 1,000,599 | 1,000,599 | 1,000,599 | 1,000,599 | 1,000,599 | |||||||||||||||
Medical Benefits | — | — | 66,403 | 66,403 | — | |||||||||||||||
Outplacement Services | — | — | — | — | — | |||||||||||||||
280G Gross Up | — | — | — | — | — | |||||||||||||||
|
|
|
|
|
|
|
|
|
| |||||||||||
TOTAL | 1,927,752 | 4,013,590 | 5,954,156 | 8,039,994 | 4,013,590 | |||||||||||||||
Dana S. Hendricks | ||||||||||||||||||||
Cash Severance-Annual Salary | — | — | 375,000 | 750,000 | — | |||||||||||||||
Cash Severance-Average Annual Incentive | — | — | 95,208 | 190,416 | — | |||||||||||||||
Equity Compensation Vesting(2) | 96,431 | 215,394 | 96,431 | 215,394 | 215,394 | |||||||||||||||
Deferred Compensation(3) | — | — | — | — | — | |||||||||||||||
Medical Benefits | — | — | 33,202 | 49,803 | — | |||||||||||||||
Outplacement Services | — | — | 10,000 | 10,000 | — | |||||||||||||||
280G Gross Up | — | — | — | — | — | |||||||||||||||
|
|
|
|
|
|
|
|
|
| |||||||||||
TOTAL | 96,431 | 215,934 | 609,841 | 1,215,613 | 215,934 | |||||||||||||||
W. Stancil Starnes | ||||||||||||||||||||
Cash Severance-Annual Salary | — | — | — | — | — | |||||||||||||||
Cash Severance-Average Annual Incentive | — | — | — | — | — | |||||||||||||||
Equity Compensation Vesting(2) | 253,611 | 1,625,758 | 253,611 | 253,611 | 253,611 | |||||||||||||||
Deferred Compensation(3) | 1,878,465 | 1,878,465 | 1,878,465 | 1,878,465 | 1,878,465 | |||||||||||||||
Medical Benefits | — | — | — | — | — | |||||||||||||||
Outplacement Services | — | — | — | — | — | |||||||||||||||
280G Gross Up | — | — | — | — | — | |||||||||||||||
|
|
|
|
|
|
|
|
|
| |||||||||||
TOTAL | 2,132,076 | 3,504,223 | 2,132,076 | 2,132,076 | 2,132,076 | |||||||||||||||
Michael L. Boguski | ||||||||||||||||||||
Cash Severance-Annual Salary | — | — | 2,716,250 | 2,716,250 | — | |||||||||||||||
Cash Severance-Average Annual Incentive | — | — | 1,845,000 | 1,845,000 | — | |||||||||||||||
Equity Compensation Vesting(2) | 528,604 | 1,763,921 | 528,604 | 1,763,921 | 1,763,921 | |||||||||||||||
Deferred Compensation(3) | 133,727 | 133,727 | 133,727 | 133,727 | 133,727 | |||||||||||||||
Medical Benefits | — | — | 99,605 | 99,605 | — | |||||||||||||||
Outplacement Services | — | — | — | — | — | |||||||||||||||
280G Gross Up | — | — | — | — | — | |||||||||||||||
|
|
|
|
|
|
|
|
|
| |||||||||||
TOTAL | 662,331 | 1,897,649 | 5,323,186 | 6,558,504 | 1,897,649 | |||||||||||||||
Kevin M. Shook | ||||||||||||||||||||
Cash Severance-Annual Salary | — | — | 410,000 | 820,000 | — | |||||||||||||||
Cash Severance-Average Annual Incentive | — | — | 301,711 | 603,421 | — | |||||||||||||||
Equity Compensation Vesting(2) | 184,421 | 461,544 | 184,421 | 461,544 | 461,544 | |||||||||||||||
Deferred Compensation(3) | 75,153 | 75,153 | 75,153 | 75,153 | 75,153 | |||||||||||||||
Medical Benefits | — | — | 33,202 | 49,803 | — | |||||||||||||||
Outplacement Services | — | — | 10,000 | 10,000 | — | |||||||||||||||
280G Gross Up | — | — | — | — | — | |||||||||||||||
|
|
|
|
|
|
|
|
|
| |||||||||||
TOTAL | 259,574 | 536,797 | 1,014,486 | 2,019,921 | 536,697 | |||||||||||||||
|
45
| Retirement or Voluntary Termination | Death or Disability | Involuntary Termination(1) | Involuntary Termination After Change of Control(1) | Change of Control | |||||||||||||||||||||||||
| $ | $ | $ | $ | $ | |||||||||||||||||||||||||
| Edward L. Rand, Jr. | |||||||||||||||||||||||||||||
| Cash Severance-Annual Salary | — | — | 2,000,000 | 2,000,000 | — | ||||||||||||||||||||||||
| Cash Severance-Average Annual Incentive | — | — | 2,400,000 | 2,400,000 | — | ||||||||||||||||||||||||
Equity Compensation Vesting(2) | 1,541,483 | 3,556,087 | 1,541,483 | 3,556,087 | 3,556,087 | ||||||||||||||||||||||||
Deferred Compensation(3) | 1,495,347 | 1,495,347 | 1,495,347 | 1,495,347 | 1,495,347 | ||||||||||||||||||||||||
| Medical Benefits | — | — | 49,624 | 49,624 | — | ||||||||||||||||||||||||
| Outplacement Services | — | — | — | — | — | ||||||||||||||||||||||||
| TOTAL | 3,036,830 | 5,051,434 | 7,486,454 | 9,501,058 | 5,051,434 | ||||||||||||||||||||||||
| Dana S. Hendricks | |||||||||||||||||||||||||||||
| Cash Severance-Annual Salary | — | — | 475,000 | 950,000 | — | ||||||||||||||||||||||||
| Cash Severance-Average Annual Incentive | — | — | 322,721 | 645,443 | — | ||||||||||||||||||||||||
Equity Compensation Vesting(2) | 214,984 | 699,395 | 214,984 | 699,395 | 699,395 | ||||||||||||||||||||||||
| Non-Compete | — | — | — | — | — | ||||||||||||||||||||||||
Deferred Compensation(3) | 11,331 | 11,331 | 11,331 | 11,331 | 11,331 | ||||||||||||||||||||||||
| Medical Benefits | — | — | 25,212 | 37,818 | — | ||||||||||||||||||||||||
| Outplacement Services | — | — | 10,000 | 10,000 | — | ||||||||||||||||||||||||
| TOTAL | 226,315 | 710,726 | 1,059,248 | 2,353,987 | 710,726 | ||||||||||||||||||||||||
| Jeffrey P. Lisenby | |||||||||||||||||||||||||||||
| Cash Severance-Annual Salary | — | — | 510,000 | 1,020,000 | — | ||||||||||||||||||||||||
| Cash Severance-Average Annual Incentive | — | — | 348,923 | 697,845 | — | ||||||||||||||||||||||||
Equity Compensation Vesting(2) | 266,757 | 815,009 | 266,757 | 815,009 | 815,009 | ||||||||||||||||||||||||
Deferred Compensation(3) | 288,161 | 288,161 | 288,161 | 288,161 | 288,161 | ||||||||||||||||||||||||
| Medical Benefits | — | — | 14,886 | 22,330 | — | ||||||||||||||||||||||||
| Outplacement Services | — | — | 10,000 | 10,000 | — | ||||||||||||||||||||||||
| 280G Gross Up | — | — | — | — | — | ||||||||||||||||||||||||
| TOTAL | 554,918 | 1,103,170 | 1,438,727 | 2,853,345 | 1,103,170 | ||||||||||||||||||||||||
| Michael L. Boguski | |||||||||||||||||||||||||||||
| Cash Severance-Annual Salary | — | 946,667 | 946,667 | 1,420,000 | — | ||||||||||||||||||||||||
| Cash Severance-Average Annual Incentive | — | — | 946,667 | 1,416,450 | — | ||||||||||||||||||||||||
Equity Compensation Vesting(2) | 286,645 | 286,645 | 286,645 | 881,369 | 881,369 | ||||||||||||||||||||||||
| Non-Compete | — | — | — | — | — | ||||||||||||||||||||||||
Deferred Compensation(3) | 233,940 | 233,940 | 233,940 | 233,940 | 233,940 | ||||||||||||||||||||||||
| Medical Benefits | — | — | — | — | — | ||||||||||||||||||||||||
| Outplacement Services | — | — | — | — | — | ||||||||||||||||||||||||
| TOTAL | 520,585 | 1,467,252 | 2,413,919 | 3,951,759 | 1,115,309 | ||||||||||||||||||||||||
| Kevin M. Shook | |||||||||||||||||||||||||||||
| Cash Severance-Annual Salary | — | — | 465,000 | 930,000 | — | ||||||||||||||||||||||||
| Cash Severance-Average Annual Incentive | — | — | 396,208 | 792,416 | — | ||||||||||||||||||||||||
Equity Compensation Vesting(2) | 266,757 | 815,009 | 266,757 | 815,009 | 815,009 | ||||||||||||||||||||||||
| Non-Compete | — | — | — | — | — | ||||||||||||||||||||||||
Deferred Compensation(3) | 118,649 | 118,649 | 118,649 | 118,649 | 118,649 | ||||||||||||||||||||||||
| Medical Benefits | — | — | 25,212 | 37,818 | — | ||||||||||||||||||||||||
| Outplacement Services | — | — | 10,000 | 10,000 | — | ||||||||||||||||||||||||
| TOTAL | 385,406 | 933,658 | 1,281,826 | 2,703,892 | 933,658 | ||||||||||||||||||||||||
|
|
46
(2) The value of the acceleration of equity compensation benefits is calculated to reflect our accounting expense for the unvested performance shares and stock awards that have not been earned for financial reporting purposes. The value of the unvested awards is based on the market value of a share of Common Stock of $17.47 based on the closing price on the NYSE on December 30, 2022 (the last trading day of 2022). We calculated the number of shares based on the target achievement levels since the unvested performance shares and stock awards have not been earned yet; therefore, it is possible that the actual amounts could be higher or lower, or that the performance criteria is not achieved so that no amount is payable. We disclose the threshold, target and maximum achievement levels in the table under the caption “Grants of Plan-Based Awards” on page 28 of this proxy statement.
Name | Fees Earned or Paid in Cash ($) | Stock Awards (1) ($) | Non- Equity Incentive Plan Compensation ($) | Change in Pension Value and Nonqualified Deferred Compensation Earnings | All Other Compensation ($) | Total ($) | ||||||||||||||||||
Kedrick D. Adkins Jr | 100,417 | 61,000 | — | — | — | 161,417 | ||||||||||||||||||
Bruce D. Angiolillo | 106.917 | 61,000 | — | — | — | 167,917 | ||||||||||||||||||
Samuel A. Di Piazza | 110,333 | 61,000 | — | — | — | 171,333 | ||||||||||||||||||
Robert E. Flowers | 94,708 | 61,000 | — | — | — | 155,708 | ||||||||||||||||||
Maye Head Frei | 46,333 | 61,000 | — | — | — | 107,333 | ||||||||||||||||||
M. James Gorrie | 77,333 | 61,000 | — | — | — | 138,333 | ||||||||||||||||||
Ziad R. Haydar | 78,833 | 61,000 | — | — | — | 139,833 | ||||||||||||||||||
Frank A. Spinosa | 101,417 | 61,000 | — | — | — | 162,417 | ||||||||||||||||||
Katisha T. Vance. | 77,333 | 61,000 | — | — | — | 138,333 | ||||||||||||||||||
Thomas A. S. Wilson, Jr. | 101,167 | 61,000 | — | — | — | 162,167 | ||||||||||||||||||
|
| Name | Fees Earned or Paid in Cash | Stock Awards ($) | NonEquity Incentive Plan Compensation ($) | Change in Pension Value and Nonqualified Deferred Compensation Earnings | All Other Compensation ($) | Total ($) | ||||||||||||||
| Kedrick D. Adkins Jr | 92,042 | 95,000 | — | — | — | 187,042 | ||||||||||||||
| Bruce D. Angiolillo | 155,146 | 95,000 | — | — | — | 250,146 | ||||||||||||||
| Fabiola Cobarrubias | 88,292 | 95,000 | — | — | — | 183,292 | ||||||||||||||
| Samuel A. Di Piazza | 91,417 | 95,000 | — | — | — | 186,417 | ||||||||||||||
| Maye Head Frei | 89,646 | 95,000 | — | 264,377 | — | 449,023 | ||||||||||||||
| M. James Gorrie | 74,333 | 95,000 | — | — | — | 169,333 | ||||||||||||||
| Ziad R. Haydar | 83,500 | 95,000 | — | — | — | 178,500 | ||||||||||||||
| Frank A. Spinosa | 75,333 | 95,000 | — | — | — | 170,333 | ||||||||||||||
| Scott C. Syphax | 76,833 | 95,000 | — | — | — | 171,833 | ||||||||||||||
| Katisha T. Vance. | 91,000 | 95,000 | — | — | — | 186,000 | ||||||||||||||
| Thomas A. S. Wilson, Jr. | 80,583 | 95,000 | — | — | — | 175,583 | ||||||||||||||
Non-management2022.
47
request that the Company purchase the shares granted and accumulated under the plan at the time the director terminates his or her service on the Board.
27.
48
The ratio of the annual total compensation of Mr. Rand to the median of the annual total compensation of our employees for 20192022 was 38.940 to 1.
•the annual total compensation of Mr. Rand for 2019,2022, as set forth in the Summary Compensation Table, was $3,738,428;$4,367,132; and
•the median of the annual total compensation of all of our employees (other than Mr. Rand), determined in accordance with Item 402(u) of RegulationS-K, was $96,125.
2022.
| Year | Summary Compensation Table Total for PEO | Compensation Actually Paid to PEO(1) | Average Summary Compensation Table Total for Non-PEO Named Executive Officers | Average Compensation Paid to Non-PEO Named Executive Officers(2) | Valuation of Initial Fixed $100 Investment Based On: | Net Income (Loss) | Company- Selected Performance Measure | ||||||||||||||||||||||
Total Shareholder Return ("TSR")(3) | Peer Group Total Shareholder Return(4) | Non-GAAP Operating Income (Loss) | Non-GAAP Operating ROE | ||||||||||||||||||||||||||
| 2022 | $ | 4,367,132 | $ | 2,668,350 | $ | 1,556,544 | $ | 1,114,689 | $ | 50 | $ | 134 | $ | (401,948) | $ | 24,508,779 | 1.9 | % | |||||||||||
| 2021 | $ | 3,149,575 | $ | 3,851,913 | $ | 1,412,587 | $ | 1,559,032 | $ | 72 | $ | 119 | $ | 144,123,894 | $ | 75,891,905 | 5.8 | % | |||||||||||
| 2020 | $ | 2,490,725 | $ | 466,261 | $ | 1,188,025 | $ | 573,379 | $ | 50 | $ | 103 | $ | (175,726,830) | $ | (27,741,383) | 1.4 | % | |||||||||||
| PEO | |||||||||||
| 2022 | 2021 | 2020 | |||||||||
| Total Compensation as reported | $ | 4,367,132 | $ | 3,149,575 | $ | 2,490,725 | |||||
| Fair Value of equity awards granted during fiscal year | (2,000,000) | (949,998) | (950,000) | ||||||||
| Fair value of equity compensation granted in current year—value at end of year-end | 1,410,577 | 976,633 | 516,835 | ||||||||
| Change in fair value for end of prior fiscal year to vesting date for awards made in prior fiscal years that vested during current fiscal year | (3,032) | 26,503 | (10,320) | ||||||||
| Change in fair value from end of prior fiscal year to end of current fiscal year for awards made in prior fiscal years that were unvested at end of current fiscal year | (961,611) | 718,332 | (1,364,139) | ||||||||
| Dividends or other earnings paid on stock or options awards in the covered fiscal year prior to the vesting date that are not otherwise included in the total compensation for the covered fiscal year | — | — | — | ||||||||
| Fair value of awards forfeited in current fiscal year determined at end of prior fiscal year | (144,716) | (69,132) | (216,840) | ||||||||
| Compensation Actually Paid to CEO | $ | 2,668,350 | $ | 3,851,913 | $ | 466,261 | |||||
| NEO Averages | |||||||||||
| 2022 | 2021 | 2020 | |||||||||
| Total Compensation as reported | $ | 1,556,544 | $ | 1,412,587 | $ | 1,188,025 | |||||
| Fair Value of equity awards granted during fiscal year | (462,500) | (393,731) | (368,742) | ||||||||
| Fair value of equity compensation granted in current year—value at end of year-end | 326,196 | 404,770 | 200,609 | ||||||||
| Change in fair value for end of prior fiscal year to vesting date for awards made in prior fiscal years that vested during current fiscal year | (5,155) | 19,804 | (7,632) | ||||||||
| Change in fair value from end of prior fiscal year to end of current fiscal year for awards made in prior fiscal years that were unvested at end of current fiscal year | (213,566) | 150,168 | (330,461) | ||||||||
| Dividends or other earnings paid on stock or options awards in the covered fiscal year prior to the vesting date that are not otherwise included in the total compensation for the covered fiscal year | — | — | — | ||||||||
| Fair value of awards forfeited in current fiscal year determined at end of prior fiscal year | (86,830) | (34,566) | (108,420) | ||||||||
| Compensation Actually Paid to NEO | $ | 1,114,689 | $ | 1,559,032 | $ | 573,379 | |||||
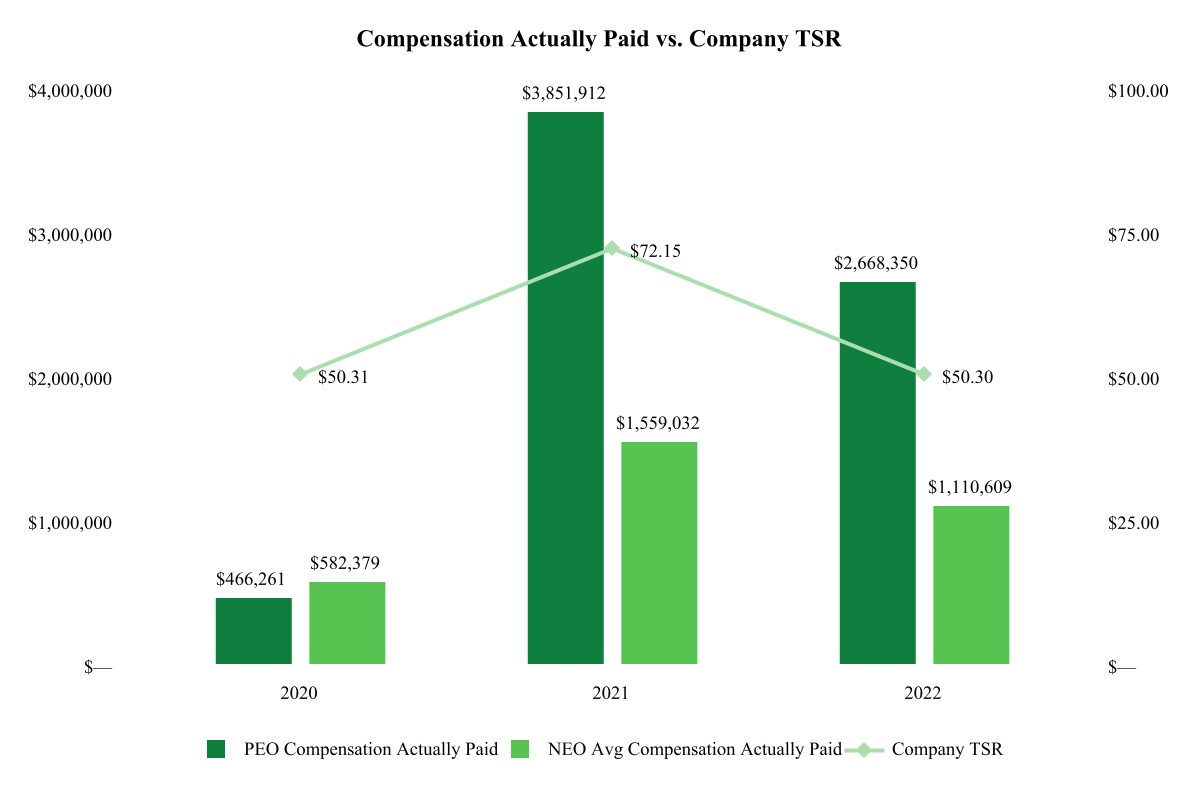
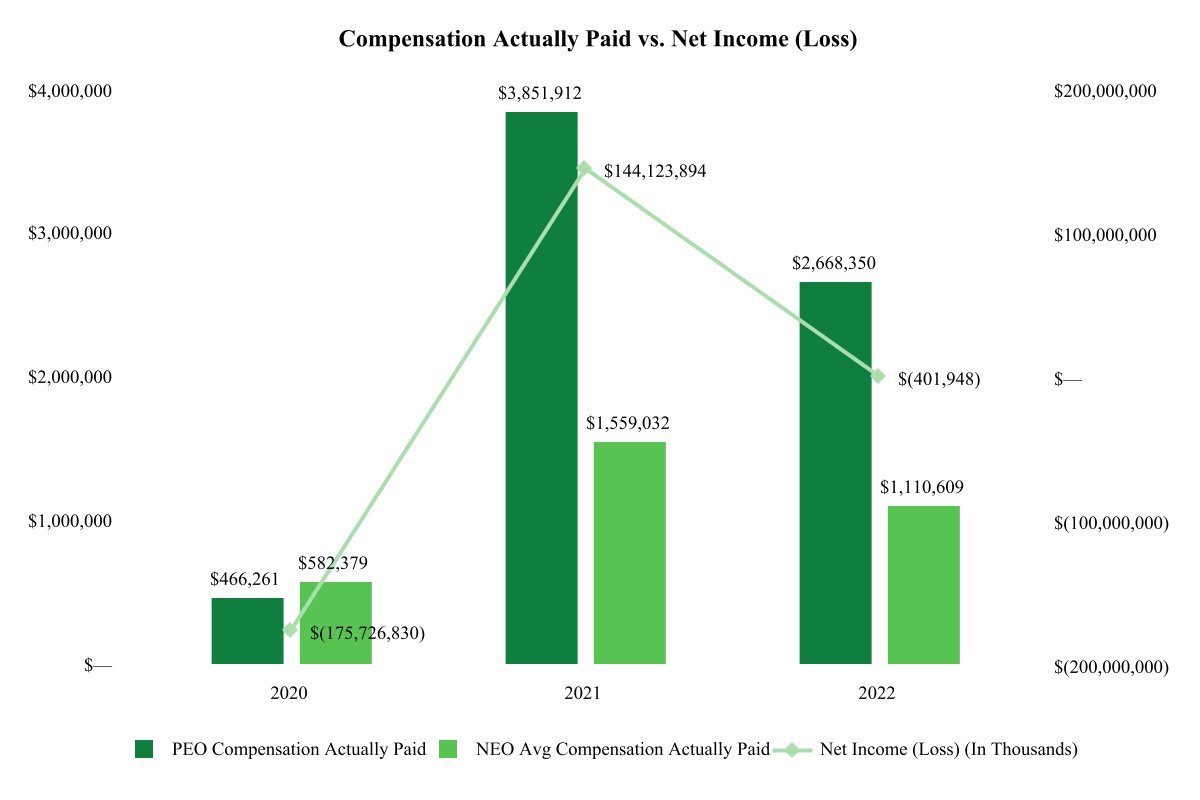
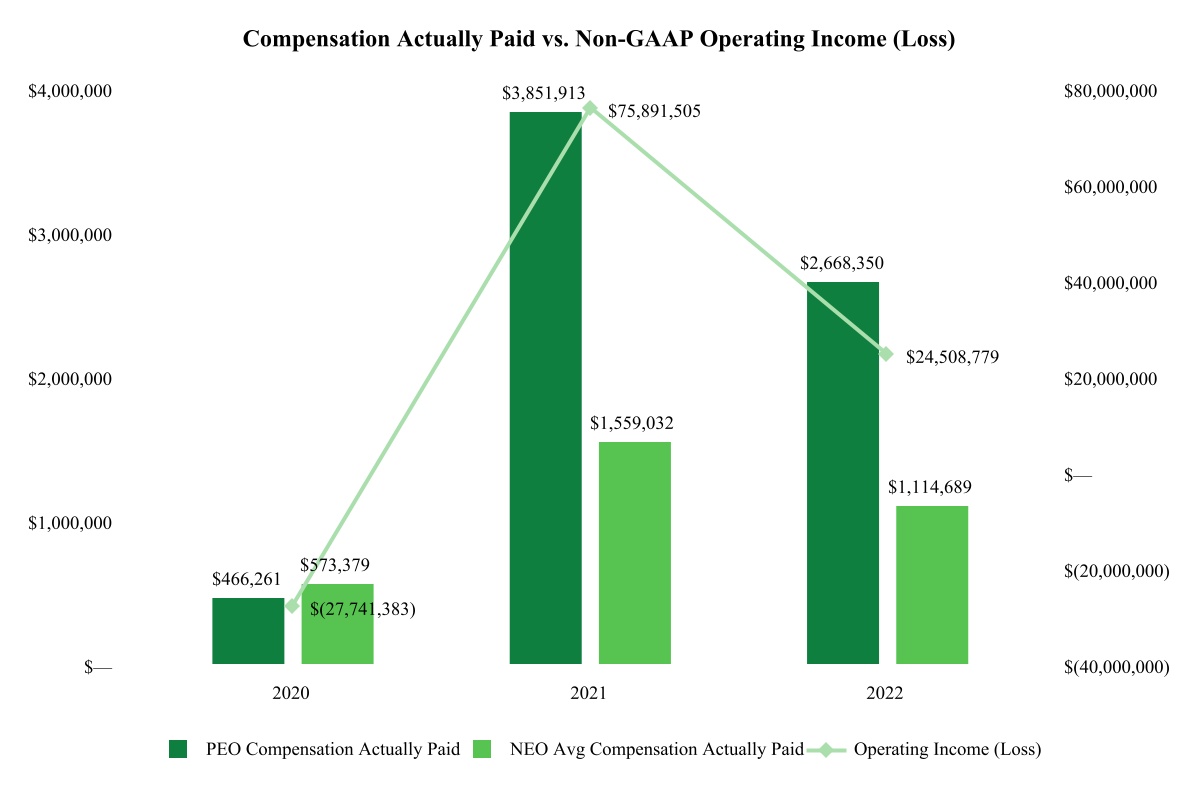
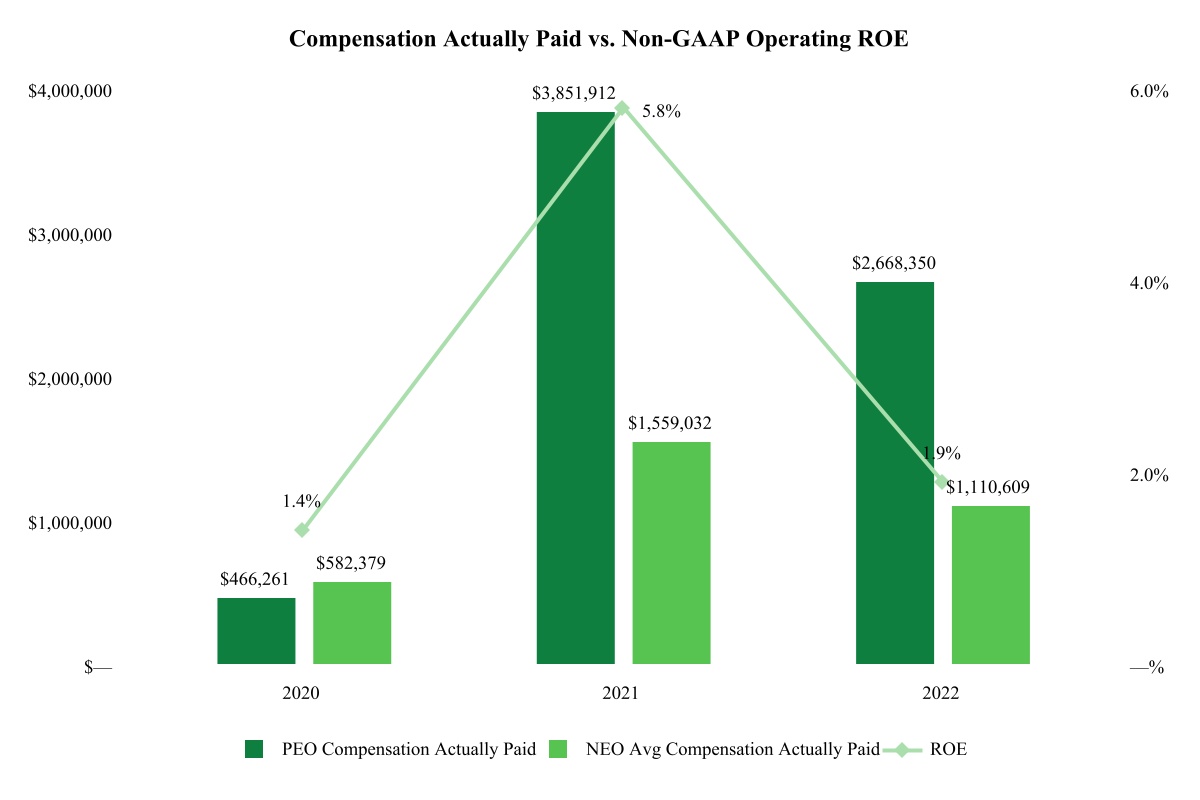
49
Stockholders | Amount & Nature of Beneficial Ownership(1) | Percent of Class(1) | ||||||
BlackRock, Inc.(2) | 7,774,702 | 14.5 | % | |||||
55 East 52nd Street | ||||||||
New York, New York 10055 | ||||||||
The Vanguard Group, Inc.(3) | 5,982,784 | 11.12 | % | |||||
100 Vanguard Blvd. | ||||||||
Malvern, Pennsylvania 19355 | ||||||||
American Century Investment Management, Inc.(4) | 5,403,607 | 10.05 | % | |||||
4500 Main Street, 9th Floor | ||||||||
Kansas City, Missouri 64111 | ||||||||
|
|
|
|
| Stockholders | Amount & Nature of Beneficial Ownership(1) | Percent of Class(1) | ||||||||||||
BlackRock, Inc.(2) | 7,851,712 | 14.60 | % | |||||||||||
| 55 East 52nd Street New York, New York 10055 | ||||||||||||||
The Vanguard Group, Inc.(3) | 6,237,886 | 11.56 | % | |||||||||||
| 100 Vanguard Blvd. Malvern, Pennsylvania 19355 | ||||||||||||||
Wellington Management Group LLP(4) | 3,438,325 | 6.37 | % | |||||||||||
| 280 Congress Street Boston, MA 02210 | ||||||||||||||
•our executive officers named in the Summary Compensation Table under “Executive Compensation,” which we refer to as the “Named Executive Officers;”
•our directors and director nominees; and
•all of our directors and executive officers as a group.
50
| Stockholders | Amount & Nature of Beneficial Ownership(1) | Percent of Class | ||||||||||||
| Directors | ||||||||||||||
| Kedrick D. Adkins Jr. | 14,861 | * | ||||||||||||
| Bruce D. Angiolillo | 17,515 | * | ||||||||||||
| Fabiola Cobarrubias | 7,075 | * | ||||||||||||
| Samuel A. Di Piazza, Jr. | 26,834 | * | ||||||||||||
| Maye Head Frei | 13,173 | * | ||||||||||||
| M. James Gorrie | 28,941 | * | ||||||||||||
| Ziad R. Haydar | 22,371 | * | ||||||||||||
Edward L. Rand, Jr.(2) | 147,661 | * | ||||||||||||
| Frank A. Spinosa | 24,164 | * | ||||||||||||
| Scott C. Syphax | 7,075 | * | ||||||||||||
| Katisha T. Vance | 16,026 | * | ||||||||||||
| Thomas A. S. Wilson, Jr. | 26,941 | * | ||||||||||||
| Other Named Executive Officers | ||||||||||||||
| Dana S. Hendricks | 17,870 | * | ||||||||||||
| Jeffrey P. Lisenby | 69,924 | * | ||||||||||||
| Michael L. Boguski | 55,932 | * | ||||||||||||
| Kevin M. Shook | 25,040 | * | ||||||||||||
| All Directors, Director Nominees and Executive Officers as a Group (16 Persons) | 521,403 | 0.97% | ||||||||||||
| * Less than 1%. | ||||||||||||||
Stockholders | Amount & Nature of Beneficial Ownership(1) | Percent of Class | ||||
Directors | ||||||
Kedrick D. Adkins Jr. | 3,233 | * | ||||
Bruce D. Angiolillo. | 5,776 | * | ||||
Samuel A. Di Piazza, Jr. | 14,939 | * | ||||
Robert E. Flowers | 90,403 | * | ||||
Maye Head Frei. | 1,616 | * | ||||
M. James Gorrie | 16,881 | * | ||||
Ziad R. Haydar | 10,556 | * | ||||
Edward L. Rand, Jr.(2) | 121,341 | * | ||||
Frank A. Spinosa | 11,765 | * | ||||
W. Stancil Starnes | 210,367 | * | ||||
Katisha T. Vance | 4,349 | * | ||||
Thomas A. S. Wilson, Jr. | 14,881 | * | ||||
| Other Named Executive Officers | ||||||
Dana S. Hendricks | 4,657 | * | ||||
Michael L. Boguski | 34,338 | * | ||||
Kevin M. Shook | 15,085 | * | ||||
| All Directors, Director Nominees and Executive Officers as a Group (16 Persons) | 622,339 | 1.16% | ||||
|
|
|
•Employees are prohibited from (i) taking for themselves personally opportunities that are discovered through the use of ProAssurance’s information or position, (ii) using ProAssurance’s property, information or position for personal gain and (iii) competing with ProAssurance.
•If ProAssurance or a subsidiary does business or considers doing business with a company in which an employee or member of his or her family is employed or has a material financial or other interest, the employee must disclose the interest to his or her supervisor if he or she is aware of the proposed business relationship and refrain from participating in the approval process.
•If an employee participates in religious, charitable, educational or civic activities, good judgment must be exercised to abstain from involvement in activities which would present a conflict of interest or interfere with responsibilities to or the reputation of ProAssurance.
51
the Company determines would be required to be publicly disclosed by Item 404(a) of RegulationS-K, and apply to directors, nominees for directors, executive officers and certain persons related to any of the foregoing (related parties). The procedures are administered by the Company’s general counsel acting as Corporate Compliance Officer. The general counsel monitors compliance and reviews annually a completed questionnaire from each director, nominee for director and executive officer that sets forth certain business and other affiliations that relate to the business and activities of the Company. The general counsel reports any related party transaction he becomes aware of to the Nominating/Corporate Governance Committee. The committee must evaluate the transaction to determine whether it is fair and reasonable to the Company, and should also evaluate the impact the transaction will have on a director’s independence, if applicable.
fiscal year ended December 31, 2022.
•the name and address of the stockholder who intends to make the nomination and of the person or persons to be nominated;
52
•a representation that the stockholder is a holder of record at the time of such notice and intends to be a holder of record on the record date for such meeting and intends to appear in person or by proxy at the meeting to nominate the person or persons specified in the notice;
•a description of all arrangements or understandings between the stockholder and each nominee and any other person or persons (naming such person or persons) pursuant to which the nomination or nominations are to be made by the stockholder;
•such other information regarding each nominee proposed by such stockholder as would have been required to be included in a proxy statement filed pursuant to the proxy rules of the SEC had the Board of Directors solicited proxies for the election of such nominee at the meeting; and
•the consent of each nominee to serve as a director of ProAssurance if so elected.
•a brief description of the business desired to be brought before the meeting and the reasons for considering such matter or matters at the meeting;
•the name and address of the stockholder who intends to propose such matter or matters;
•a representation that the stockholder has been a holder of record of stock of ProAssurance entitled to vote at such meeting for a period of one year and intends to hold such shares through the date of the meeting and appear in person or by proxy at such meeting to propose such matter or matters;
•any material interest of the stockholder in such matter or matters; and
•a description of all understandings or relationships between the stockholder and any other person(s) (naming such persons) with respect to the capital stock of ProAssurance as to the matter specified in the notice.
53
has received contrary instructions from any beneficial owner at that address. This practice, known as “householding,” is designed to reduce printing and mailing costs. If any beneficial stockholder(s) sharing a single address wishes to discontinue householding and receive a separate copy of the Notice of Internet Availability or the Proxy Materials, as the case may be, they may contact Broadridge, either by calling(866) 540-7095, or by writing to Broadridge, Householding Department, 51 Mercedes Way, Edgewood, New York 11717.
54
 |  | |||||
|
| |||||
| ||||||
| ||||||
 | ||||||
TO VOTE, MARK BLOCKS BELOW IN BLUE OR BLACK INK AS FOLLOWS: ☒
KEEP THIS PORTION FOR YOUR RECORDS
DETACH AND RETURN THIS PORTION ONLY
THIS PROXY CARD IS VALID ONLY WHEN SIGNED AND DATED.
|
|
|
|  |
| |||||||||||||||||||||||||||||||||||||||
| ||||||||||||||||||||||||||||||||||||||||||||
| ||||||||||||||||||||||||||||||||||||||||||||
|
|
|
| |||||||||||||||||||||||||||||||||||||||||
| ||||||||||||||||||||||||||||||||||||||||||||
| ||||||||||||||||||||||||||||||||||||||||||||
| ||||||||||||||||||||||||||||||||||||||||||||
|  | |||||||||||||||||||||||||||||||||||||||||||
|
| ||||||||||||||||||||||||||||||||||||||||||||
| ||||||||||||||||||||||||||||||||||||||||||||
 | ||||||
Important Notice Regarding the Availability of Proxy Materials for the Annual Meeting: The Annual Report, Notice & Proxy Statement is/are available atwww.proxyvote.com
| ||||||||
| ||||||||
| ||||||||
| ||||||||
*** Exercise YourRight to Vote ***
Important Notice Regarding the Availability of Proxy Materials for the
Stockholder Meeting to Be Held on May 20, 2020
| ||||||||
| ||||||||
| ||||||||
|
| |||||||
 |
| |||||||
|
|
| ||||||
| ||||||||
| ||||||||
— Before You Vote —
How to Access the Proxy Materials
| ||||||||
| ||||||||
 (located on the following page) and visit: (located on the following page) and visit: | ||||||||
| ||||||||
| ||||||||
| ||||||||
| ||||||||
| ||||||||
| ||||||||
| ||||||||
|
| |||||||
| ||||||||
|
| ||||||||
| ||||||||
| ||||||||
| ||||||||
|
| |||||||


 (located on the following page) in the subject line.
 available and follow the instructions.